ERP investment / Operations transformation / Financial modelling
Meridian Precision Components: Make the ERP earn its place
A process-first manufacturing transformation strategy that tests an ERP investment against operational evidence, working-capital economics and production risk.
The recommendation
Fund the operating foundations now. Release ERP investment only when the evidence and economics justify it.
Meridian's revenue grew 22.1% between 2024 and 2026 while EBITDA slipped from RM 5.40m to RM 5.35m. Fragmented stock records, duplicate purchasing, unstable schedules and manual reporting create a credible operational problem, but they do not automatically establish a profitable ERP purchase. The five-year model supports RM 269,800 of process, data and control improvements: base-case NPV is RM 359,969 at 12%, including inventory cash release. Immediate cloud ERP has negative NPV of RM 94,636; ERP with advanced analytics also exceeds the initial-investment cap and 12-month horizon. The recommended route commits to the foundations, requests firm ERP quotations in parallel and makes any later purchase conditional on measurable readiness, better terms and an incremental comparison with stopping after process improvement.
Decision at stake
Approve the RM 0.27m foundations programme with a RM 0.30m ceiling. Keep cloud ERP conditional on a month-four investment gate; reject advanced analytics at this stage.
A fictional Malaysian precision-components manufacturer with two plants, 185 employees, 2,850 active SKU records and a three-person IT team. The supplied management accounts, operational data, interviews and employee survey are synthetic case evidence; vendor costs are preliminary estimates.
Evidence and decision parameters
- Modelled process-first NPV
- RM 0.36m
- Five-year base case at 12%, including net one-time inventory cash; this is a simulated investment result.
- Modelled simple payback
- 11.3 months
- Process improvement, interpolated from annual cash flows. Discounted payback is 12.9 months.
- Margin gap attributed to operations
- 47-66%
- 47% from reported excess cost pools; 66% when the analyst's rework-cost estimate is included.
Growth exposed an operating-model problem
The board's question was whether digital transformation could recover operating performance without disrupting either factory. It did not begin with approval to buy an ERP. The case therefore compares continuing with current systems, improving processes, buying a cloud ERP core, adding advanced analytics and sequencing a gated combination of process improvement and ERP.
The financial warning is visible before any technology discussion. Revenue rose from RM 39.8m in 2024 to RM 48.6m in 2026, but COGS rose faster, from RM 29.5m to RM 37.1m. Gross margin fell from 25.9% to 23.7%; EBITDA margin fell from 13.6% to 11.0%. Administrative and selling costs broadly followed revenue, while inventory, emergency purchasing, write-offs and overtime grew much faster.
The diagnostic uses 2024 operating intensity, scaled by the 1.221 revenue-growth factor, as its comparison baseline. This separates increased activity from deteriorating control. It is a reasonable case-analysis method, but it does not establish causation: product mix, input prices and operating complexity could also have changed.
Swipe horizontally to view all columns.
| Measure | 2024 | 2025 | 2026 |
|---|---|---|---|
| Revenue (RM m) | 39.8 | 44.2 | 48.6 |
| COGS (RM m) | 29.5 | 33.2 | 37.1 |
| Gross margin | 25.9% | 24.9% | 23.7% |
| EBITDA (RM m) | 5.40 | 5.50 | 5.35 |
| Average inventory (RM m) | 5.2 | 6.4 | 8.1 |
| Inventory accuracy | 94% | 91% | 86% |
Historical years belong to the fictional case. These are supplied inputs, rather than actual client results.
Source: Financial model, Assumptions!C39:E52; final report, section 2.
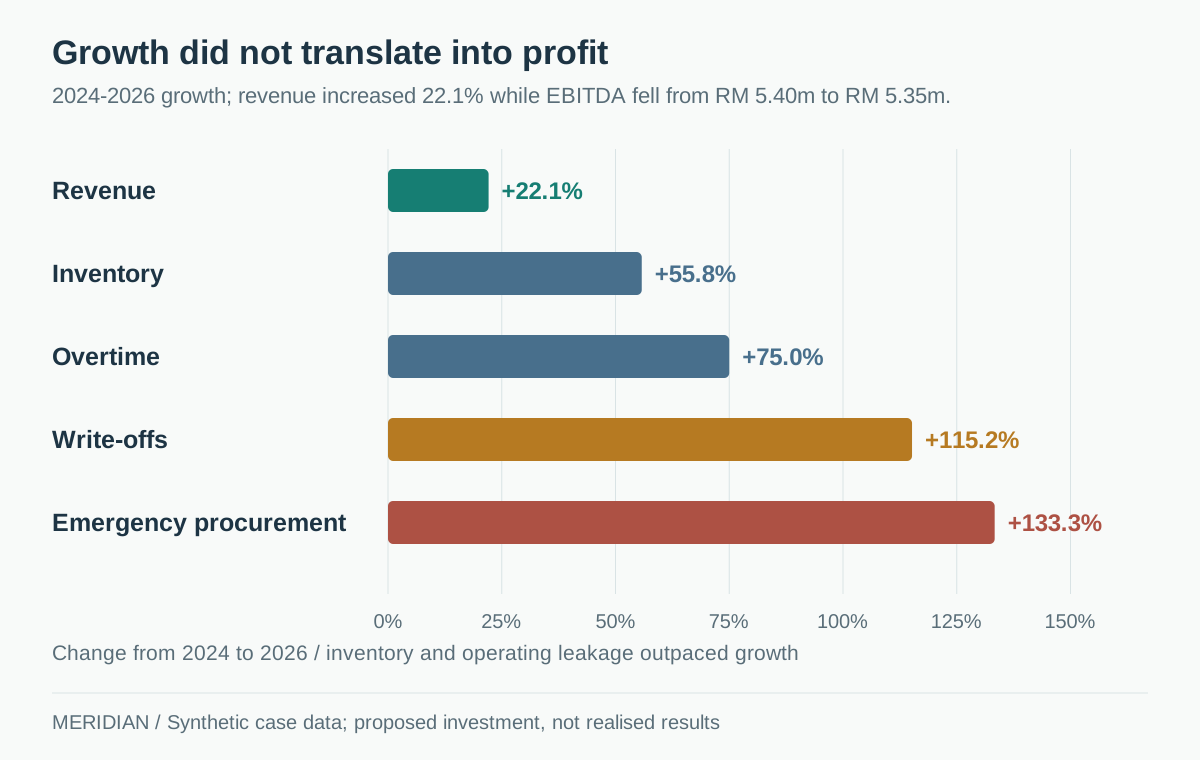
Figure 1. Operating leakage grew faster than revenue
The comparison normalises different measures as percentage growth. It identifies deteriorating operating intensity without assuming that every cost increase was avoidable or caused by the absence of ERP.
Source: Redrawn from the financial model, Assumptions!C39:E49, and final report, Figure 2. Synthetic case data.
Test the CFO and operations explanations against the same baseline
The CFO suspected material-price inflation; the Operations Director blamed inventory and procurement inefficiency. At the 2024 gross margin, 2026 gross profit would have been about RM 1.077m higher. Three reported cost pools explain RM 504,387 of that gap: excess emergency procurement, inventory write-offs and overtime. This is 46.8% of the gap, before making any rework assumption.
The report estimates excess rework at RM 207,760, using the 1.4-percentage-point increase in rework, 2026 COGS and an assumed 40% conversion-cost share. Including it lifts the operational attribution to RM 712,147, or 66.1%. The remaining RM 365,240 is unresolved. Commodity prices, supplier purchase-price variance, product mix and customer price pass-through data were not supplied, so the material-cost explanation remains an open question.
This prevents a common investment error: treating the whole margin gap as recoverable ERP value. Even the identified pools are only partly addressable. Supplier disruption can still generate emergency orders, genuine demand can still require overtime, and calibration or operator skills need a quality-engineering response.
Swipe horizontally to view all columns.
| Cost pool | 2026 gross | Excess over baseline | ERP capture assumption |
|---|---|---|---|
| Emergency procurement premium | RM 420,000 | RM 200,201 | 55% |
| Inventory write-offs | RM 312,000 | RM 134,940 | 55% |
| Overtime | RM 560,000 | RM 169,246 | 35% |
| Rework conversion cost (estimate) | RM 682,640 | RM 207,760 | 12%; traceability/revision only |
The emergency-cost figure is interpreted in the source as incremental procurement premium, rather than total purchase value. Capture percentages are analyst assumptions, not measured savings.
Source: Financial model, Baseline_Diagnostic!C19:C32 and Assumptions!D57:D60; report, sections 2 and 9.
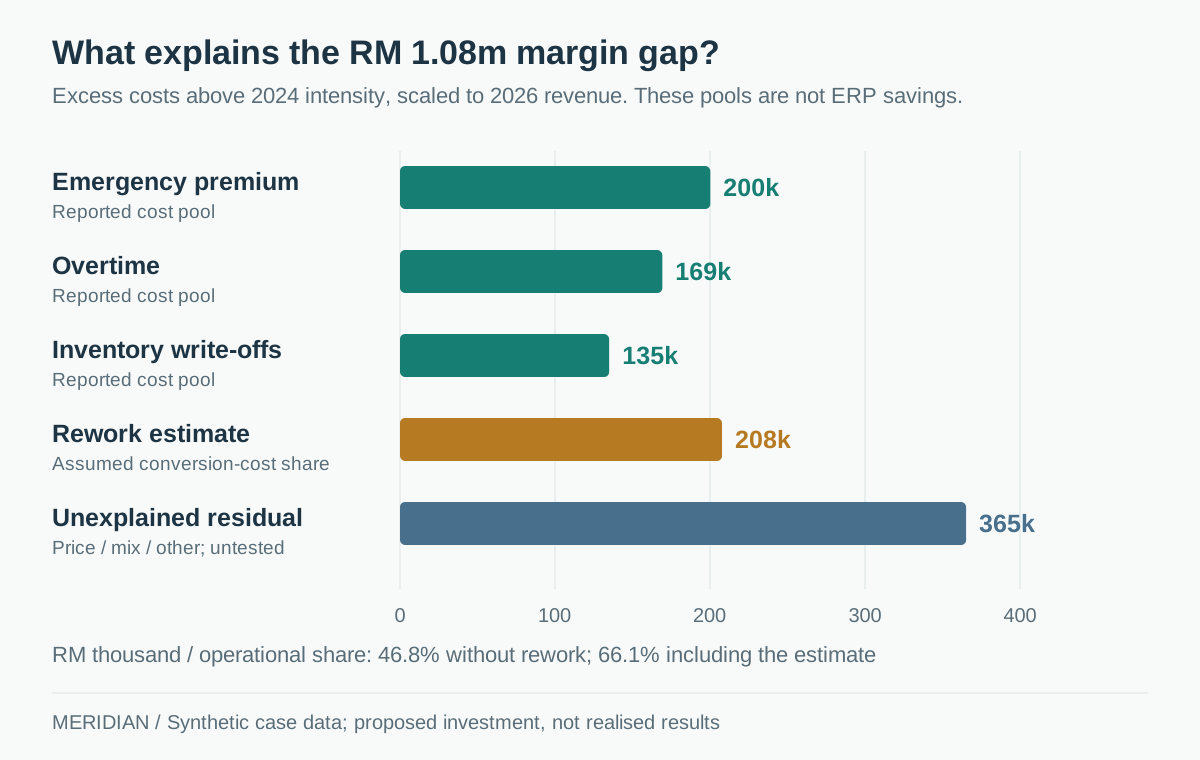
Figure 2. Reported pools explain 47% of the margin gap
The identified operational share rises from 46.8% to 66.1% only when the rework-cost estimate is included. These are avoidable cost pools before option-specific capture assumptions, not an ERP savings promise.
Source: Financial model, Baseline_Diagnostic!C18:C25; current-state diagnostic, section 2. Rework conversion share is an analyst assumption.
Repair the handoffs before automating them
Purchasing currently passes through seven manual steps: a planner identifies a need, re-enters it into departmental sheets, procurement consolidates it, a PO is built in Excel and emailed, goods are received into a warehouse sheet, and finance manually matches the invoice. None of these handoffs reliably checks a shared stock position. Duplicate item codes make the same physical material appear to be different products.
The first response is one requisition form, duplicate-order checking, an approval matrix, emergency-order cause codes and weekly supplier-date confirmation. Inventory needs a governed item master, bin and location discipline, cycle counts, adjustment approvals and ABC-XYZ policies that distinguish item value and demand variability. Production needs one shared schedule, a 48-72-hour freeze window and a logged exception process.
Plant B is the most useful first inventory cutover: its 83% stock accuracy and 19-minute picking time are weaker than Plant A's 88% and 14 minutes, while the source assesses its customer mix as lower risk than Plant A's semiconductor work. That is a sequencing decision, not a reason to relax the migration gate. ERP should embed these controls and connect the plants once the rules work consistently.
Reporting is another process problem before it is a dashboard problem. Finance consolidates five sources into about 40 recurring reports, requiring 260 hours a month. The recommendation first rationalises these into an owned pack of about 15 KPIs, preserving the time needed for validation and management commentary.
Swipe horizontally to view all columns.
| Measure | Plant A | Plant B | Combined |
|---|---|---|---|
| Active SKU records | 1,650 | 1,200 | 2,850; includes duplication |
| Inventory accuracy | 88% | 83% | 86% reported |
| Average picking time | 14 minutes | 19 minutes | Plant B is 36% slower |
| Adjustments per month | 145 | 210 | 355 |
| Stockouts per month | 18 | 27 | 45 |
| Warehouse staff | 12 | 9 | 21 |
Source: Current-state diagnostic, section 5; final report, sections 4-8; process maps, pages 2-4.
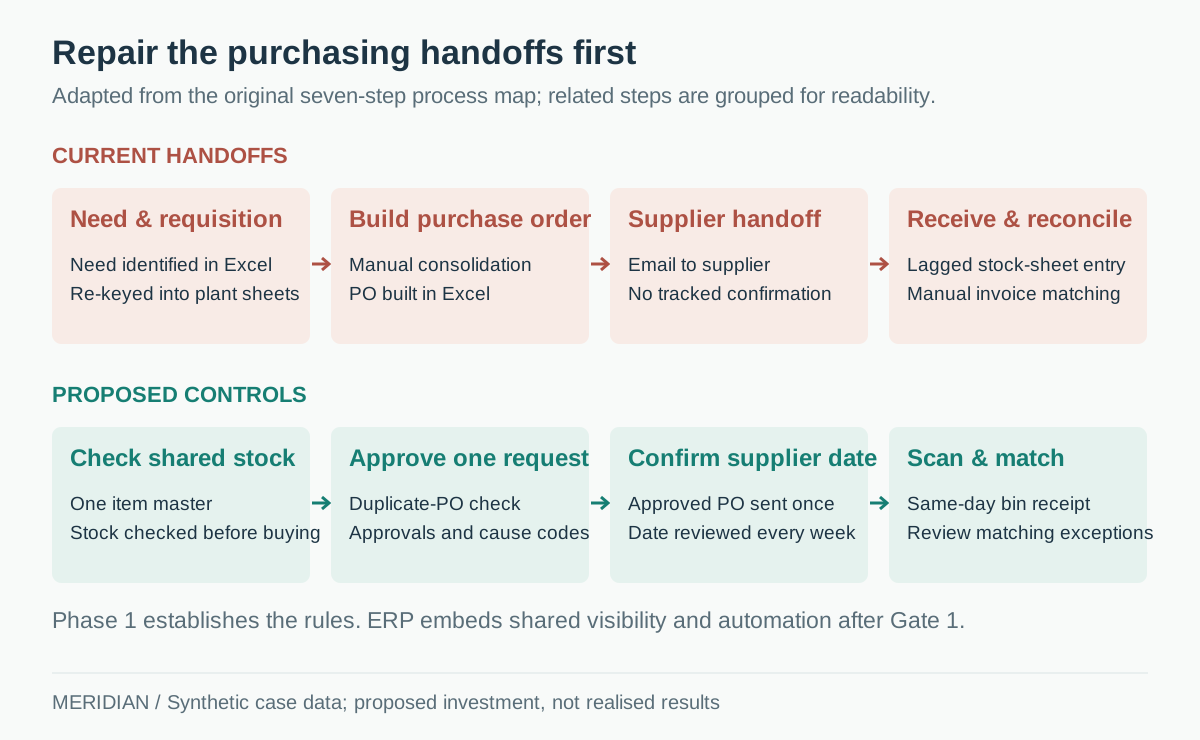
Figure 3. Connect the purchasing controls before adding automation
The original seven-step workflow is grouped into four readable stages. Phase 1 establishes master data, approvals and cause codes; ERP-dependent shared visibility, scanning and automation remain conditional on the investment gate.
Source: Adapted from the original Process Maps PDF, page 2, and final report, section 4. Proposed future state, not an implemented system.
Inventory cash is a balance-sheet release, not annual profit
Average inventory increased by RM 2.9m. Holding the exact 2024 inventory-to-COGS ratio constant, COGS growth explains RM 1.340m, or 46.2% of that increase; the remaining RM 1.560m is associated with higher inventory intensity. The source's sentence saying volume explains roughly 55% reverses these proportions. The article uses the calculation rather than repeating that sentence.
At RM 37.1m of annual COGS, one inventory day is worth RM 101,644. Moving from the model's 79-day baseline to an illustrative 65 days therefore releases RM 1.423m once. The model separately applies a 5% liquidation haircut and a 2% recurring cash holding-cost benefit. Financing savings are excluded from the investment cash flows to avoid adding a second value for the same released cash.
The reported RM 8.1m inventory balance actually implies 79.69 days, so a balance-based calculation gives RM 1.493m released at 65 days. The RM 70,137 difference comes from the rounded 79-day model baseline. Neither number is an achieved result. The option appraisals retain the supplied model's convention so their returns remain reproducible.
Stock reduction must be selective. Slow movers, duplicate stock and inaccurate records need investigation before safety stock is reduced on critical items. Weekly stockout monitoring and protected A-class items guard against exchanging a cash release for production stoppages.
Swipe horizontally to view all columns.
| Component | Calculation | Treatment |
|---|---|---|
| Daily COGS | RM 37.1m / 365 = RM 101,644 | Conversion factor |
| Gross cash released | 14 days × RM 101,644 = RM 1,423,014 | One-time balance-sheet cash |
| Liquidation haircut | 5% = RM 71,151 | One-time cost |
| Cash holding-cost benefit | 2% = RM 28,460 per year | Recurring operating benefit |
| Illustrative financing benefit | 6% = RM 85,381 per year | Memo only; excluded from NPV |
This 65-day illustration is distinct from each option's own target: 75 days for process improvement, 68 for cloud ERP and 65 for ERP plus analytics. The five-year model also scales inventory requirements with volume growth.
Source: Financial model, Baseline_Diagnostic!C43:C51 and Assumptions!C66:E66; report, section 3.
Keep cash savings, capacity and quality claims separate
Processing 4,800 purchase orders at 42 minutes each consumes 3,360 hours a year, equivalent to 1.75 full-time roles at 1,920 hours per employee. Even a 50% reduction frees only 0.88 of a role. The eight-person team is retained, so this is capacity rather than a payroll saving. The base case credits a 35% PO-time reduction for cloud ERP and monetises only 35% of released capacity across purchasing, reporting and search.
The model values search and recount effort at 4,830 hours a year, using assumed hours per stockout and adjustment. These hours require a four-week time study; the source does not contain transaction-level observations. Released time should be assigned to supplier management, counting and exception prevention, with cash value recognised only when avoided overtime or an evidenced hiring decision supports it.
Benefits also need an overlap map. Duplicate purchases are reflected through inventory and write-offs; their full order value is not added again. Production interruption is represented through excess overtime, rather than a second downtime line. Schedule adherence and stock accuracy enable benefits but are not separately monetised. Customer retention is an assumed margin benefit linked to delivery performance, with no customer-level churn data to validate it.
The source is internally inconsistent about rework: some narrative says to exclude it from ERP, while the financial model includes a limited 12% capture of the excess pool for cloud ERP, worth RM 24,931 at 2026 volume before ramp and growth. The article reports the model as supplied and makes that credit explicit. Calibration, supplier quality, statistical process control and operator training remain a separate engineering programme.
Compare the operating routes, including their full cost
The technology requirements follow the diagnosis: one governed item, supplier and customer master; multi-plant inventory with locations and scanning; purchasing approvals; connected sales orders and finance; basic planning; and usable audit trails. Advanced planning and forecasting are later options because the required routing and historical data are not yet dependable.
The weighted evaluation gives process improvement 4.05 out of 5, the phased route 3.80, immediate cloud ERP 3.15 and ERP with analytics 1.95. Financial return carries 25% of the score; root-cause fit and implementation risk carry 15% each. These scores are structured analyst judgements, not vendor test results. Process improvement scores highest on cost and risk but only 1 out of 5 on scalability.
Vendor estimates exclude important enabling costs. The cloud core's RM 820,000 estimate becomes RM 1.193m after contingency, RM 120,000 of internal backfill, RM 90,000 of scanners and RM 40,000 of cybersecurity setup. Annual administration and governance also sit alongside the licence. The advanced option's RM 1.927m loaded initial cost breaches the RM 1.5m cap, and month-14 go-live breaches the transformation horizon.
The vendor scorecard requires manufacturing references, migration tools, plant-by-plant rollback, open interfaces, access controls and recovery evidence. Statutory and security fit are acceptance gates. The source mentions Malaysian tax and e-invoicing requirements as items for the eventual procurement team to validate; this historical simulation does not certify present-day regulatory compliance.
Swipe horizontally to view all columns.
| Route | Loaded initial | Five-year TCO | Weighted score / 5 |
|---|---|---|---|
| A · Process improvement | RM 269,800 | RM 625,376 | 4.05 |
| B · Cloud ERP | RM 1,193,000 | RM 2,760,050 | 3.15 |
| C · ERP + analytics | RM 1,927,400 | RM 4,627,460 | 1.95 |
| P · Process-first, then ERP | RM 1,316,500 | RM 2,857,716 | 3.80 |
TCO includes initial and recurring expenditure, excludes benefits and is undiscounted. Vendor shortlists in the source scorecard are unpopulated; no named product is selected.
Source: Technology evaluation workbook, Weighted_Matrix!C13:F13 and TCO!B10:E11; Base scenario.
Only the process-first investment clears the base-case hurdles
The appraisal compares 2027-2031 cash flows with continuing at 2026 inefficiency rates, growing volume at 3% a year. Initial investment is placed at the start of 2027; operating flows are at year-end. Benefits ramp monthly after go-live and are reduced by the scenario's realisation factor. The discount rate is 12%, with no tax, grants, financing structure or terminal value.
The board requires positive NPV, IRR above 12%, five-year ROI of at least 20%, simple payback within 36 months and initial investment no greater than RM 1.5m. Process improvement passes. Cloud ERP's 8.7% IRR and 40.4-month payback fail, even though its undiscounted five-year ROI is positive. The phased route remains negative at today's estimates; sequencing reduces implementation exposure but does not make its economics automatically attractive.
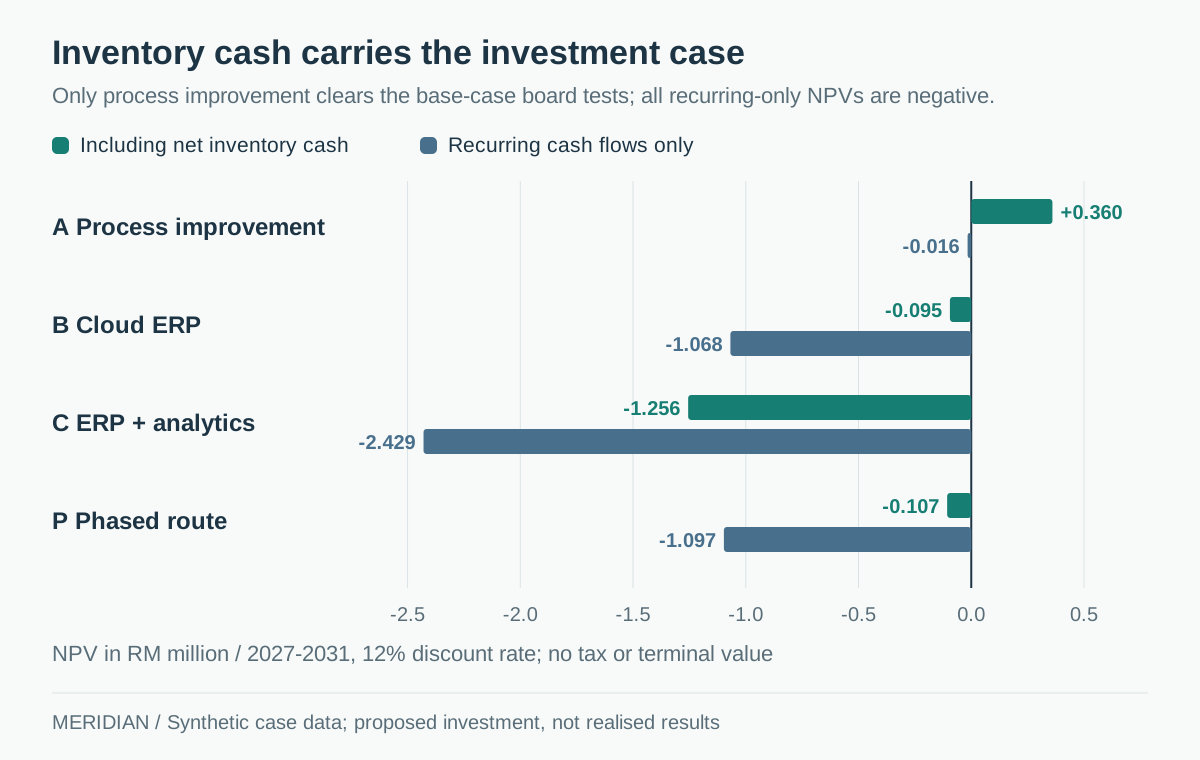
The second NPV view is decisive. Removing net inventory cash leaves process improvement slightly negative at RM 16,265 and cloud ERP negative at RM 1.068m. The return is substantially a working-capital case. By 2031, the cloud option generates RM 512,770 of operating benefit against RM 355,256 of annual recurring cost, leaving RM 157,514 before any additional inventory cash. These forecast benefits must be distinguished from realised EBITDA improvement.
I independently recomputed NPV, ROI and interpolated payback from all four options' cached cash flows, and checked each reported IRR by substituting it back into the NPV equation. The results reconcile with the workbook. This verifies the arithmetic of the supplied outputs; it does not validate the synthetic inputs or prove the assumptions will occur.
Swipe horizontally to view all columns.
| Route | NPV incl. inventory cash | NPV recurring only | IRR | Simple payback |
|---|---|---|---|---|
| A · Process improvement | +RM 359,969 | −RM 16,265 | 76.6% | 11.3 months |
| B · Cloud ERP | −RM 94,636 | −RM 1,068,229 | 8.7% | 40.4 months |
| C · ERP + analytics | −RM 1,255,556 | −RM 2,429,130 | −17.6% | Not within five years |
| P · Process-first, then ERP | −RM 106,847 | −RM 1,097,090 | 8.3% | 41.4 months |
Inventory cash includes the 5% liquidation haircut; recurring-only NPV removes the net working-capital cash flow. Simple payback interpolates annual flows, rather than measuring an actual monthly cash balance.
Source: Five-year financial model, Base scenario: Assumptions, Baseline_Diagnostic, Benefits, CashFlows and Summary. RM; pre-tax; 2027-2031.
Swipe horizontally to view all columns.
| RM thousand | 2027 | 2028 | 2029 | 2030 | 2031 |
|---|---|---|---|---|---|
| Operating benefits | 5 | 343 | 483 | 498 | 513 |
| Recurring costs | −217 | −320 | −332 | −343 | −355 |
| Net inventory cash | 91 | 1,036 | 34 | 35 | 36 |
| Total annual cash flow | −121 | 1,058 | 186 | 190 | 193 |
An additional RM 1.193m initial outflow occurs at t0. Rows are rounded independently. Later inventory cash reflects avoided working-capital requirements as the model's volume baseline grows; the same inventory balance is not released repeatedly.
Source: Financial model, CashFlows!B47:G60; report, section 12 and Appendix D.
Figure 4. The one-time inventory release carries the business case
Every recurring-only NPV is negative. Process improvement has positive total NPV because of inventory cash; immediate and phased ERP remain below the 12% hurdle at preliminary terms.
Interpretation: Modelled values in a fictional consulting simulation. Working-capital release includes the liquidation haircut; it is not recurring EBITDA improvement.
Source: Financial model, Summary!B8:E9; 2027-2031 Base case. Article calculations independently reconciled to cached cash flows.
Stress-test the case before trusting the headline return
The conservative scenario combines a 25% vendor-cost overrun, three-month delay, 80% benefit realisation, slower adoption, 7% licence inflation, 1.5% volume growth and 20% capacity monetisation. Process improvement retains positive NPV of RM 76,365, while cloud ERP falls to negative RM 921,477 and the phased route to negative RM 946,377.
The downside combines a 40% overrun, six-month delay, 60% realisation, slower adoption, 10% licence inflation, no volume growth and no monetised capacity. Process improvement falls to negative RM 174,069; cloud ERP falls to negative RM 1.646m. The phased route's initial investment reaches RM 1.544m and breaches the cap. These are stress cases, not estimated outcome probabilities.
Benefit realisation is the strongest ERP sensitivity: a 25-percentage-point change moves cloud ERP NPV by about RM 0.551m. At 6% annual volume growth, holding the other base levers fixed, cloud ERP NPV becomes positive RM 166,923. The standalone break-even alternatives are approximately 104.3% of credited benefits, a RM 185,038 annual licence, a RM 737,708 implementation estimate, or 66.99 inventory days. They are one-at-a-time tests and cannot be combined without rerunning the model.
Management's claims produce cloud ERP NPV of RM 962,509, a RM 1.057m swing from the credited base case. That reference case assumes stronger KPI gains, full monetisation of time, no cost overrun and no licence inflation. Its attractive result shows how optimistic assumptions can dominate the answer; it is not evidence that the consultant's base case has understated an achieved benefit.
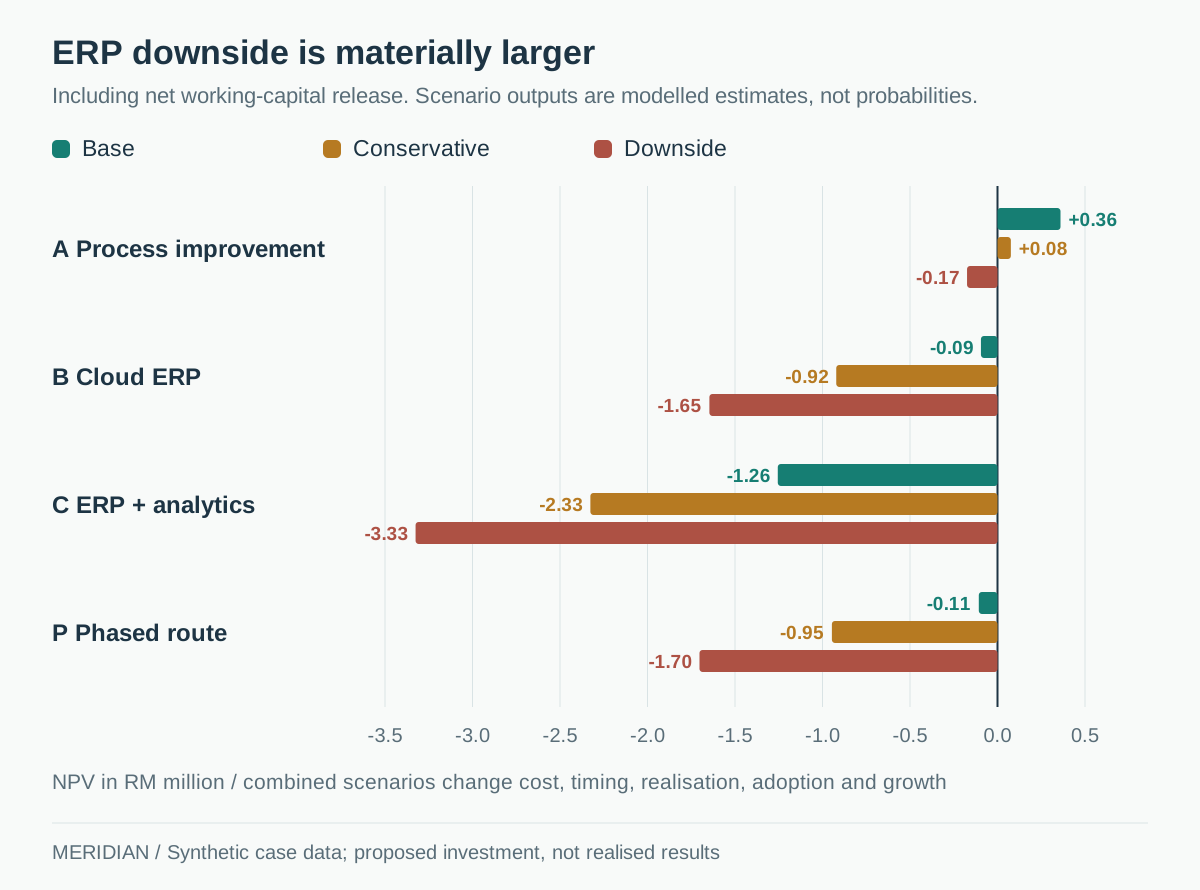
Figure 5. ERP exposure increases sharply under combined stress
The scenarios jointly change cost overruns, delay, adoption, realised benefits, licence inflation, growth and capacity monetisation. Process improvement stays positive in the conservative case, while ERP routes lose substantially more value.
Interpretation: Scenarios are stress tests, rather than outcome probabilities. The management-claims reference case is discussed separately because it assumes unverified gains and more optimistic costs.
Source: Financial model, Scenarios_Sensitivity!D5:D16 and Assumptions!F7:H13; final report, section 12.3.
Make the ERP beat the option of stopping after the foundations
A gated route preserves choice. Authorise the vendor RFP in months one to three while the data and control work proceeds. At month four, assess a fixed-price implementation target of RM 700,000, annual licence and support no greater than RM 180,000, a 15% holdback and a requested annual price-uplift cap of 3%. The procurement decision needs firm terms, rather than the estimates used in the initial appraisal.
At the model's target-terms test, the phased route improves to RM 142,659 NPV, 17.3% IRR and 28.3-month payback. It now passes the standalone tests, but still creates RM 217,311 less NPV than process improvement alone. Reaching 66 inventory days as well increases phased NPV to RM 328,427, leaving an incremental shortfall of RM 31,543. The report therefore adds a stricter incremental test: any residual gap needs owner-signed scalability or customer-mandated control benefits.
The scenario table specifies the RM 700,000/RM 180,000 test but does not separately document a 3% licence-inflation override. Its positive NPV should not be described as the result of that inflation cap. A firm quote must be entered into the live model with its actual escalation terms.
The readiness gate also requires fewer than 2% duplicate item codes, complete cleansing of A/B-class items, at least 90% accuracy in cycle-counted zones, emergency orders trending toward 9% or less, a completed time study and funded delivery capacity. The refreshed base case must meet the report's 15% gate IRR and the conservative NPV must be no worse than negative RM 0.5m. If the evidence fails, Meridian keeps the foundations benefits and postpones the software commitment.
Swipe horizontally to view all columns.
| Phased ERP scenario | Total NPV | Incremental NPV vs process-only |
|---|---|---|
| Current preliminary estimates | −RM 106,847 | −RM 466,816 |
| Target implementation and licence terms | +RM 142,659 | −RM 217,311 |
| Target terms plus 66 inventory days | +RM 328,427 | −RM 31,543 |
Process-only NPV remains RM 359,969 as the comparison. Scalability upside is illustrative and excluded from these totals. The report's incremental criterion is more complete than the shorter gate checklist in the roadmap workbook.
Source: Financial model, Scenarios_Sensitivity!C78:C80 and Summary!B8; report, section 13.
Protect production through readiness gates and plant waves
Mobilisation establishes the steering committee, baseline pack, benefit owners, time study and vendor RFP. Foundations then address item, supplier and customer records; inventory policy and counts; procurement controls; weekly sales-and-operations planning; reporting rationalisation; and a cybersecurity baseline. The ERP design and configuration phase is conditional on Gate 1.
Migration covers governed masters, stock by location, open purchase and sales orders, work in progress, ledger balances, open payables and receivables, and three years of transactions, with older history archived read-only. Three trial loads precede cutover. The final reconciliation must reach at least 99.5%, the ledger must tie, and no severity-one or severity-two defects may remain.
Cutover begins with finance, purchasing and sales orders in month ten, followed by Plant B inventory and planning in month eleven and Plant A in month twelve. A four-week parallel run, physical stock baselines, shift super-users, weekend loading and a tested rollback plan protect continuity. A delivery-performance drop greater than three percentage points at Plant A triggers a pause.
Analytics remains an option after the core is stable. The source labels this month fifteen or later but also requires twelve months of clean data. Since the ERP finishes around month twelve, the earliest review must depend on when qualifying data begins, rather than treating month fifteen as a guaranteed analytics release date.
Treat adoption and benefit ownership as part of the operating design
The synthetic survey has 120 responses from 185 employees. Among respondents, 78% say systems create unnecessary work, 72% expect integration to help, 61% worry about learning new software, 44% fear job losses and only 39% feel confident in their digital skills. Because the sampling method is unclear, the findings are directional. Assuming every non-respondent disagreed, the first result still represents about 51% of all staff; that arithmetic bound is not a confidence interval.
The change plan commits to retaining staff, deploying sixteen super-users, backfilling key users and capping training at four hours per employee per week. Role-based practice covers scanner use, reconciliation and realistic planning exceptions. The training workbook totals 1,904 planned hours, rather than the approximately 1,700 quoted in the report; the workbook total is used here, with the HR roster still needed to resolve overlapping role estimates.
The risk register contains twenty open risks: eight high, eleven medium and one low before mitigation. Average likelihood-times-impact score falls from 13.05 to a planned residual 6.55, but these ordinal scores are not probabilities and the reductions are not observed outcomes. Dirty master data, unrealised benefits, cost overruns, cutover disruption, resistance and credential compromise each have an owner and an early-warning trigger.
The CFO owns monthly benefit reporting and reruns the investment model quarterly for the first two years. Each line needs an evidence source: inventory valuation and COGS for cash release, invoice cause codes for emergency premiums, payroll and schedules for overtime, and time samples for released capacity. Any benefit below 70% of plan for two consecutive months triggers a recovery plan. Quality outcomes remain separately owned by production and QA.
Swipe horizontally to view all columns.
| KPI | Baseline | Month 6 target | Month 12 target | Month 24 target |
|---|---|---|---|---|
| Inventory days | 79 | 76 | 74 | 68 |
| Inventory accuracy | 86% | 90% | 92% | 94% |
| Emergency orders / POs | 11% | 8% | 7% | 5% |
| Duplicate POs | 2.8% | 1.0% | 0.5% | 0.3% |
| On-time delivery | 87% | 88% | 90% | 92% |
| Monthly reporting hours | 260 | 190 | 150 | 130 |
| Stockouts / month | 45 | 40 | 32 | 25 |
Source: Implementation roadmap workbook, Gates_KPIs!A19:E30; planned targets for the conditional transformation route.
Strategic priorities
Commit to the foundations
Fund master-data governance, selective stock controls, purchasing approvals, schedule discipline, reporting simplification and cybersecurity. Validate the baseline while the first improvements are introduced.
Require an incremental ERP case
Obtain firm commercial terms and compare the ERP route with retaining process-only gains. Demand evidence for inventory days, implementation capacity and any scalability benefit used to close the remaining value gap.
Defer advanced analytics
Avoid adding forecasting and advanced planning to immature data. Revisit after sufficient clean history, a stable ERP core and demonstrated benefits justify a separate investment.
Path to implementation
Proposed sequencing and decision gates.
Months 1-4 · proposed
Establish controls and decision evidence
Complete time studies and master-data standards, launch cycle counts and procurement controls, implement the cyber baseline and run the vendor RFP in parallel.
Decision gate: Gate 1 requires firm terms, signed economics including the incremental test, clean priority data, measured readiness and funded delivery capacity.
Months 4-10 · conditional
Build and prove the ERP core
Configure finance, purchasing, inventory, sales orders and basic planning. Perform three migration trials, role-based training, user acceptance testing and recovery exercises.
Decision gate: Gate 2 requires at least 99.5% reconciliation, no severity-one/two defects, at least 90% trained and proficiency-checked staff, and tested rollback.
Months 10-12 · conditional
Cut over in protected waves
Move finance and purchasing first, Plant B second and Plant A last. Use parallel running, physical counts, daily service monitoring and super-users on each shift.
Decision gate: Pause if reconciliation or customer-service safeguards fail; retain the ability to roll back.
After stability and sufficient clean history
Review benefits and the analytics option
Track cash, capacity and operating cost separately; refresh the appraisal quarterly. Consider planning or BI additions only after the clean-data and benefit criteria are met.
Decision gate: Analytics requires twelve months of qualifying clean data, inventory days at or below 70 and benefits at least 90% of the model; calendar timing alone is insufficient.
Value and measurement
The delivered case-study output is a board-ready decision package: a thirteen-page operational diagnostic, current and proposed process maps, a weighted technology evaluation, a live-formula five-year financial model, a gated implementation roadmap, a twenty-risk register, a fifteen-slide executive presentation and a thirty-five-page final report. It recommends a bounded process-first commitment and makes the later ERP purchase earn its place. No production change, cash release, client deployment or realised financial improvement is claimed.
Explore the evidence
Datasets & further reading
Download the source material to explore the analysis, inspect model assumptions, and read the full study.
Complete Meridian case-study package
All eight original deliverables, with descriptive filenames. Includes synthetic data, formula-driven models, reports, maps and the executive deck.
ZIP · 2.60 MB
- Download PDF, 1.55 MB
ERP investment and transformation report
The complete 35-page board report, including method, diagnosis, options, economics, investment gates and assumptions.
Report · PDF · 1.55 MB
- Download XLSX, 55 KB
Financial model and synthetic dataset
Nine-sheet Excel workbook with 2024-2026 synthetic inputs, live formulas, four scenarios, cash flows, sensitivities and KPI challenges.
Model · XLSX · 55 KB
- Download PDF, 959 KB
Current-state operational diagnostic
The 13-page operating baseline, root-cause analysis, cost pools and evidence limitations.
Report · PDF · 959 KB
- Download PDF, 629 KB
Current and proposed process maps
Purchasing, inventory and order-to-plan workflows, with matched pain points and proposed controls.
Supporting document · PDF · 629 KB
- Download XLSX, 15 KB
Technology evaluation and vendor criteria
Weighted options, feasibility checks, total cost of ownership and a reusable vendor evaluation scorecard.
Model · XLSX · 15 KB
- Download XLSX, 18 KB
Implementation roadmap and KPI tracker
Twelve-month workstreams, investment gates, governance, role assignments, training estimates and measurable targets.
Supporting document · XLSX · 18 KB
- Download XLSX, 13 KB
Programme risk register
Twenty risks, accountable owners, early warnings, mitigations and inherent/residual scoring.
Supporting document · XLSX · 13 KB
- Download PPTX, 104 KB
Investment-committee presentation
Fifteen editable slides presenting the diagnosis, options, stress tests, gates and requested decisions.
Presentation · PPTX · 104 KB
Sources and scope
This is a fictional consulting simulation using synthetic management accounts, operating KPIs, interviews and survey data. Vendor figures are unquoted estimates. Time studies, stock-movement logs, price-variance data, customer-level retention evidence and validated payroll inputs were unavailable. Tax, incentives, financing structure and terminal value are excluded. Forecast outputs reproduce the supplied workbook, whose causal assumptions remain unvalidated; the article flags inconsistencies in inventory attribution, rounding, rework credit, training hours and analytics timing. The original downloadable documents are preserved unchanged.
- Final consulting report · 35 pages (opens in a new tab)
Complete diagnostic, operating and technology strategy, financial appraisal, gate criteria, assumptions and implementation plan. Synthetic case; sections and appendices are cited beside the article's tables.
- Current-state diagnostic and process maps (opens in a new tab)
Thirteen-page operational diagnostic and four-page process-map companion, including current and proposed purchasing, warehouse and order-to-plan workflows.
- Financial model and synthetic dataset (opens in a new tab)
Nine-sheet live-formula workbook. Base scenario cached outputs; historical inputs and scenario assumptions are retained, with arithmetic independently cross-checked for the article.
- Technology, implementation and risk workbooks (opens in a new tab)
Weighted options, constraints, TCO, an unpopulated vendor scorecard, staged delivery plan, KPI tracker, training estimates and twenty open risks. Original source files available below.
- Investment-committee presentation · 15 slides (opens in a new tab)
Executive decision narrative and investment request, cross-checked against the full report and financial model.
Continue reading
Related case studies
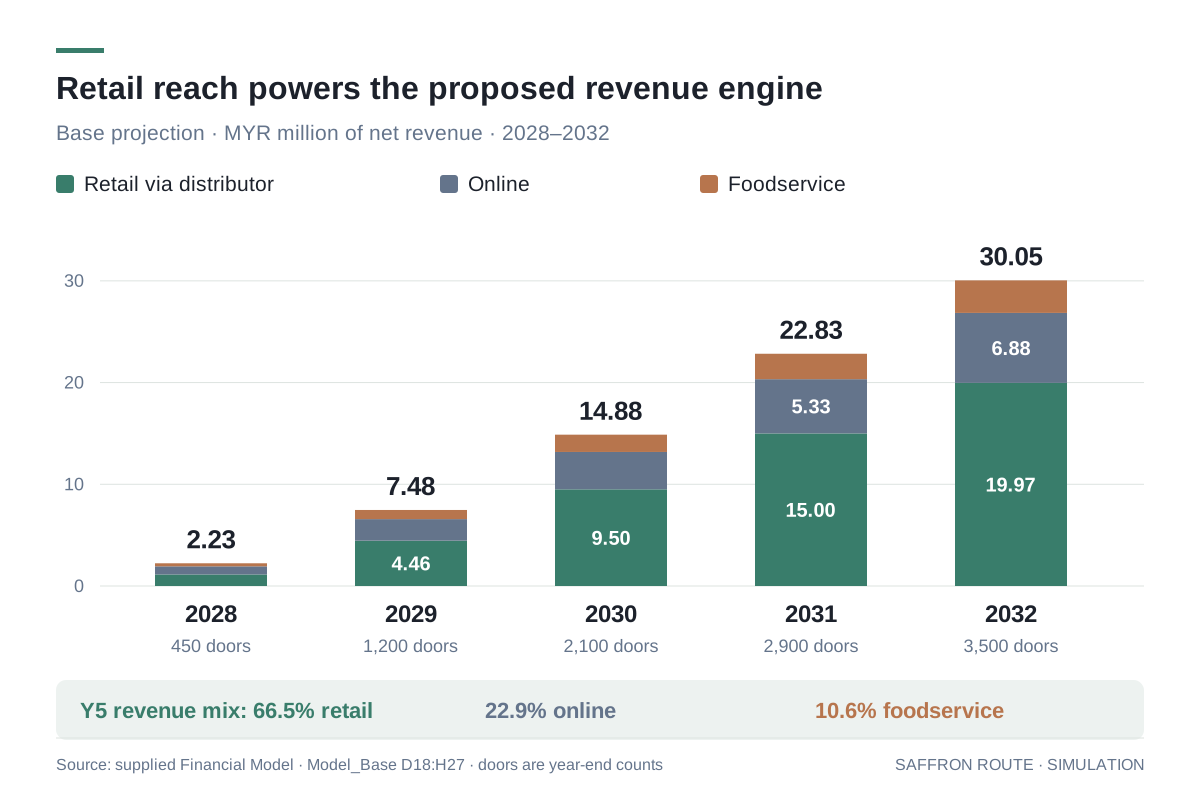
Market entry / Financial modelling / Commercial strategy
Saffron Route Foods: a staged route into Malaysia
An evidence-led market-entry case connecting consumer segmentation, distributor economics and a five-year financial model to explicit investment gates.
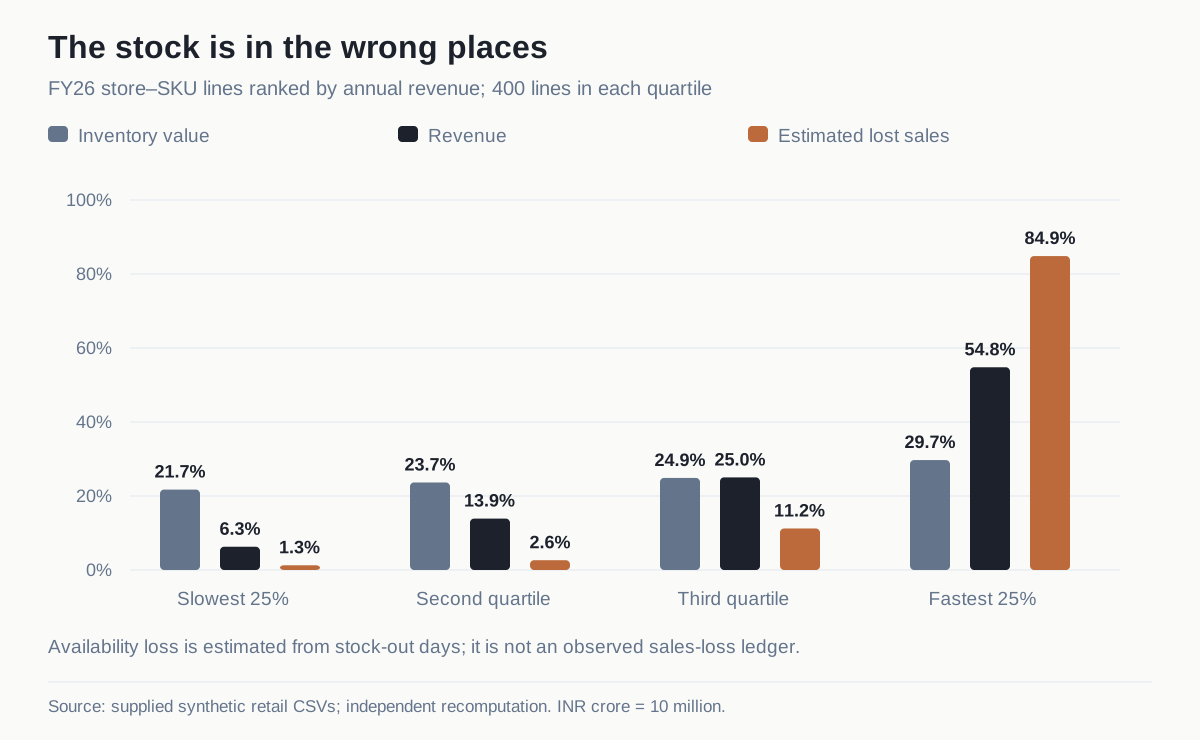
Retail operations / Profitability analytics / Inventory optimisation
Retail Operations Transformation & Profitability Optimisation
An end-to-end retail profitability diagnosis connecting store economics, assortment, inventory and a staged investment case across a simulated 20-store chain.
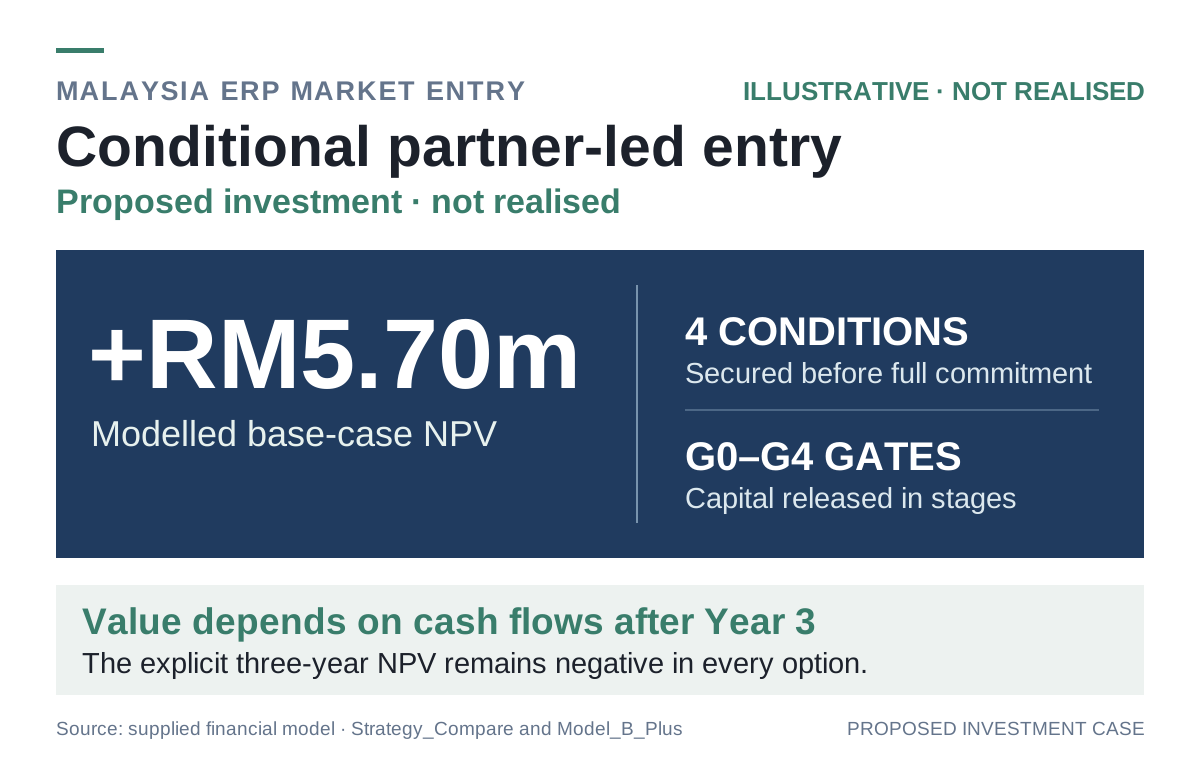
Market entry / Enterprise software / Investment modelling
Malaysia ERP market entry: a stage-gated partnership
A market-entry assessment for an illustrative Indian software company, connecting market sizing and customer focus to a conditional, capital-gated investment case.