Market entry / Financial modelling / Commercial strategy
Saffron Route Foods: a staged route into Malaysia
An evidence-led market-entry case connecting consumer segmentation, distributor economics and a five-year financial model to explicit investment gates.
The recommendation
Prove distribution and repeat demand before funding the full expansion.
The case recommends a licensed local distributor supported by Saffron Route’s own digital sales and a small foodservice operation. The sizing model estimates a MYR 429.3 million serviceable consumer market, but spend, cuisine affinity and channel reach remain assumptions. A driver-based model builds MYR 30.05 million of Year-5 net revenue and MYR 11.78 million of NPV including terminal value. The same model requires MYR 8.35 million of peak funding, remains MYR 5.02 million cash-negative cumulatively at Year 5, and has a negative MYR 5.25 million explicit-period NPV. These economics support a bounded validation programme, with later capital contingent on compliant market access, productive retail doors, retained online customers and a refreshed downside case.
Decision at stake
Whether Malaysia warrants an initial validation investment, which entry structure balances reach and control, and what commercial proof should unlock each subsequent funding tranche.
An October 2026 consulting simulation for a fictional Pune-based food company. The supplied package contains two reports, two Excel models and a 15-slide recommendation deck. Projections describe a 2027 set-up and 2028–2032 operating plan; they are modelled possibilities rather than operating results.
Evidence and decision parameters
- Modelled consumer SAM
- MYR 429.3m
- 2026 bottom-up estimate; per-capita spend, segment affinity and serviceability filters require validation.
- Year-5 net revenue
- MYR 30.05m
- 2032 base projection from retail doors, online cohorts and foodservice sales; no realised revenue is claimed.
- Peak base funding need
- MYR 8.35m
- Maximum cumulative cash deficit in Year 3; the modelled bear case requires MYR 15.66m without an early-stop rule.
A plausible market deserves a bounded investment decision
Saffron Route is a fictional mid-sized Indian manufacturer of spice blends and pastes, frozen parathas and ready meals, and namkeen snacks. The case gives it approximately INR 1,150 crore of FY2026 revenue, exports equal to 7% of sales and no Southeast Asian operating base. The relevant question is whether a business of this scale can acquire distribution and consumer trust without carrying the fixed costs of a fully owned Malaysian operation too early.
The analysis connects four decisions: which consumer need to serve, how much of the category is reachable, which entry mode can deliver the required reach, and whether the resulting cash flows justify capital at risk. It distinguishes market attractiveness from project investability. A large category can coexist with weak economics for a new entrant when listing costs, working capital, customer acquisition and local staffing absorb the gross margin.
The recommendation is therefore conditional: fund validation and partner negotiation first. Build an authentic Indian, halal-certified proposition at a near-local price only if regulatory advisers, shoppers, retailers and distributors substantiate the underlying assumptions. The study’s population and market references are source-package context; the website does not treat them as independently verified current market or legal guidance.
Build the reachable market from spend, affinity and access
The sizing workbook starts with 34.4 million residents and MYR 255 of annual category spend per person: MYR 70 on spices and pastes, MYR 55 on frozen or ready meals, and MYR 130 on savoury snacks. Multiplication yields a MYR 8,772 million total addressable market. These spending inputs are judgement assumptions, so the apparent numerical precision should not be mistaken for a measured category census.
The model then applies different Indian-style affinity assumptions to each category and consumer segment. Summed across segments, this produces a MYR 1,073.22 million Indian-style pool: MYR 429.54 million in spices and pastes, MYR 417.00 million in frozen and ready meals, and MYR 226.69 million in snacks. A 50% priority-region filter and an 80% channel-reach filter reduce the consumer SAM to MYR 429.29 million. Those filters represent strategic focus and access assumptions, not confirmed distribution coverage.
At an assumed 6.5% annual SAM growth rate, the 2032 opportunity becomes MYR 626.39 million. The sizing model’s 4.8% target gives a MYR 30.07 million SOM. The separate operational model produces MYR 30.05 million, within 0.1% of that endpoint. This is a useful reconciliation, but the target path was calibrated to the operating build; agreement between the two workbooks is not independent demand validation.
The top-down check places TAM at 3.79% of the package’s estimated 2025 food-and-beverage retail value. It tests order of magnitude, not category accuracy. A further boundary matters: the SAM is consumer retail spend, while financial revenue is net trade revenue and includes foodservice. The reported 4.8% share is consequently an approximate planning comparison. An investment model should align retail-value versus net-revenue definitions and size B2B separately.
Swipe horizontally to view all columns.
| Layer | MYR million | Calculation or boundary |
|---|---|---|
| 2026 TAM | 8,772.00 | 34.4m residents × MYR 255 annual category spend |
| Indian-style pool | 1,073.22 | Sum of category spend × segment-specific affinity |
| Priority-region pool | 536.61 | Indian-style pool × 50% regional focus |
| 2026 consumer SAM | 429.29 | Priority regions × 80% channel reach |
| 2032 consumer SAM | 626.39 | 2026 SAM × 1.065⁶; assumed growth |
| 2032 sizing-model SOM | 30.07 | 2032 SAM × 4.8% target share |
| 2032 operating-model revenue | 30.05 | Retail + online + foodservice; different revenue scope |
All layers are estimates or targets from the supplied models. The 2032 target and 2026 market layers refer to different years.
Source: Market sizing workbook, Assumptions B4/B19:B22/B31:B36, Segments F10, Funnel B5:B9/I14:I16; financial workbook, Model_Base H27.
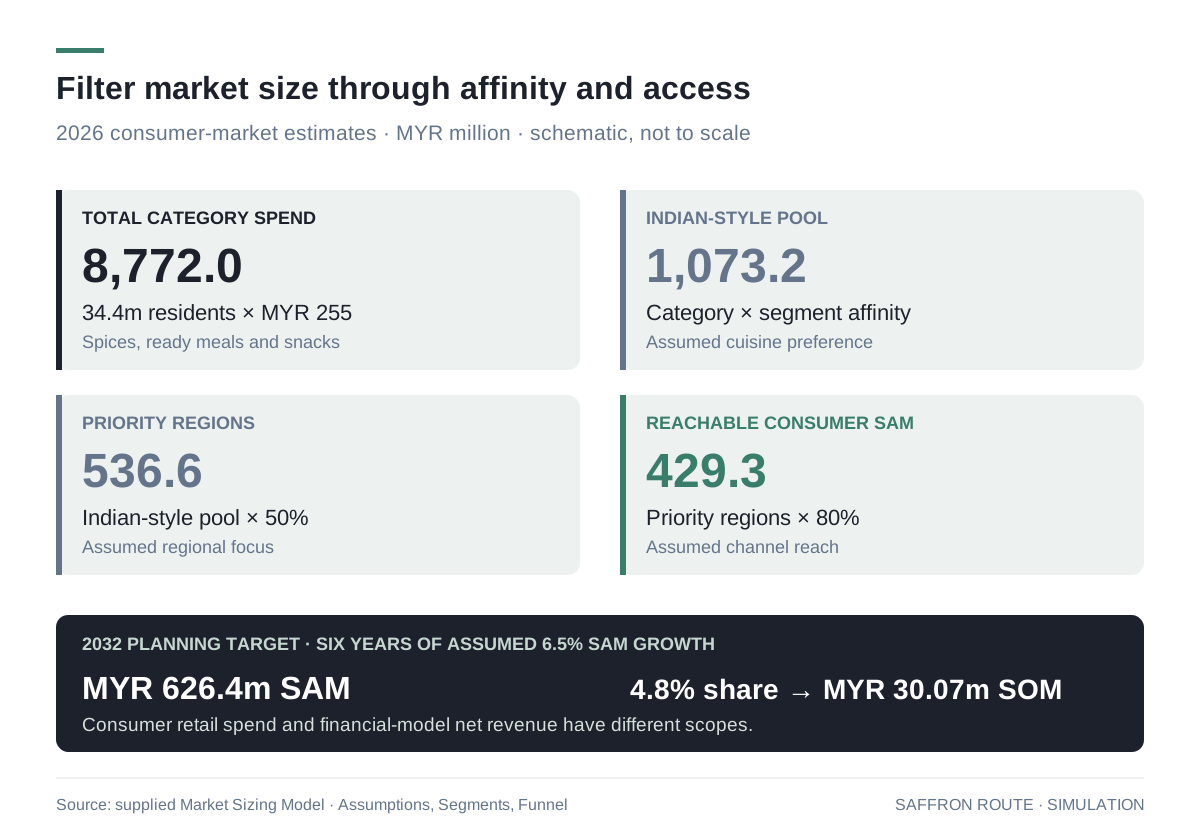
Figure 1. A modelled MYR 429.3m consumer market after affinity and access filters
Reconstructed from the supplied sizing model. Per-capita category spend, segment affinity, 50% regional focus, 80% channel reach and 6.5% SAM growth are judgement assumptions. The 2032 target is shown separately from the 2026 market layers.
Interpretation: The funnel is a schematic, not an area-scaled graphic. The financial model includes foodservice and net trade revenue, so its ratio to consumer SAM is an approximate planning comparison.
Source: Market Sizing Model, Assumptions B4/B19:B22/B31:B36; Segments F10; Funnel B5:B9/I14:I16.
Use an authenticity beachhead to reach a broader consumer base
The segment model assigns the largest absolute Indian-style spending pool to Malay and other Bumiputera consumers: MYR 719.69 million, or 67.1% of the total. Malaysian Indian consumers account for MYR 228.07 million, or 21.3%, despite comprising 6.5% of the modelled population. Their assumed annual Indian-style category spend is MYR 102 per person, making them a logical authenticity-led beachhead rather than the entire growth strategy.
The commercial implication is to use a focused range and channel proposition for each segment. Ethnic grocers can establish credibility for regional Indian flavours. Frozen paratha and curry pastes offer a convenience proposition for the broader consumer pool, conditional on recognised halal certification and suitable local labelling. Chinese and other consumers contribute MYR 125.46 million in the sizing, with snacks and convenient preparation providing hypotheses for online and modern-trade tests.
These segments are derived from assumed affinity percentages rather than observed Saffron Route purchasing. The package also combines an overall resident population with ethnic shares drawn from a different source series and acknowledges under-measured non-citizen demand. Before scaling, reconcile those population bases and use the proposed 600-person consumer survey, shelf audit and paid online pilot to replace assumptions with purchase intent, price acceptance and repeat behaviour.
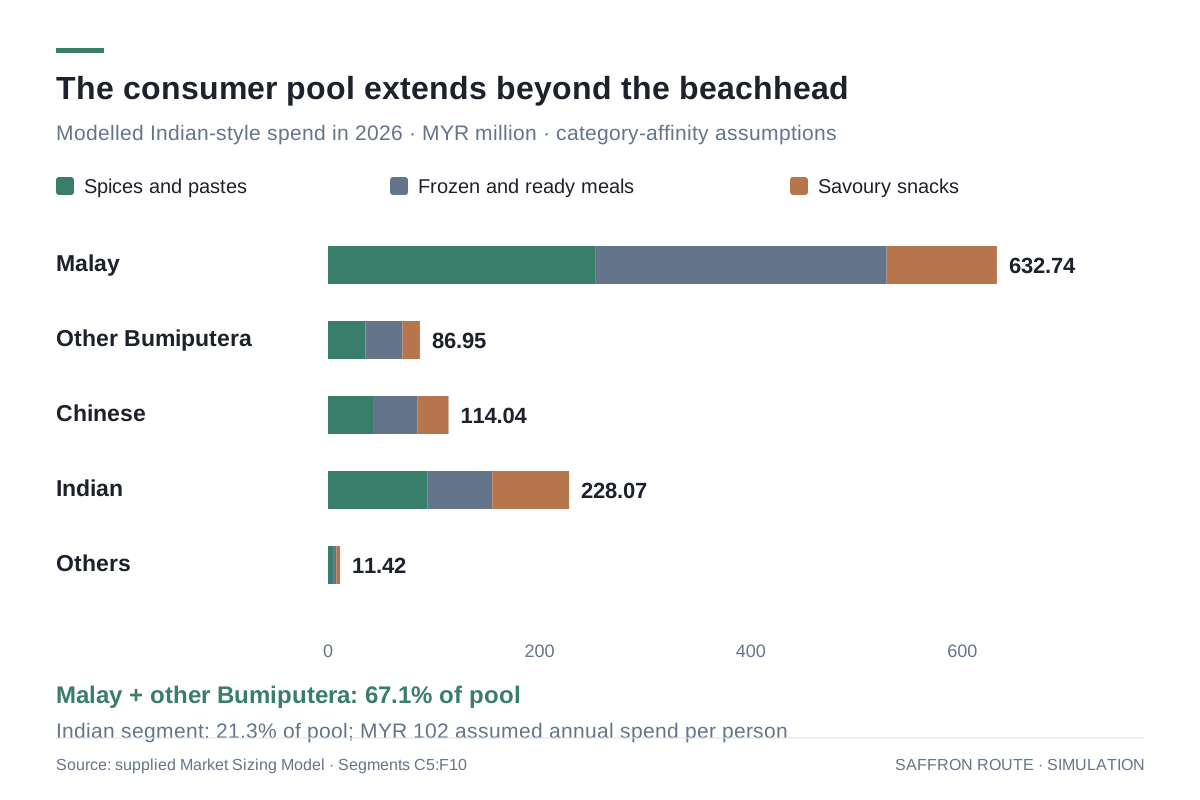
Figure 2. The largest assumed spending pool extends beyond the Indian-community beachhead
Category spending is multiplied by modelled population and segment-specific Indian-style affinity. Malay and other Bumiputera consumers together represent 67.1% of the assumed pool; Indian consumers contribute 21.3%.
Interpretation: This is modelled demand, not observed purchases. Population and ethnic-share source bases should be reconciled and affinity assumptions tested with consumer research.
Source: Market Sizing Model, Segments B5:J10; Assumptions B11:B15/B19:B21/B26:F28.
The proposed opening is authenticity with dependable availability
The market assessment groups competitors into local curry and spice brands, multinational cooking aids, local frozen roti and paratha suppliers, Indian imports, and local snack leaders. The point is to compare the source of competitive advantage: incumbents combine price, availability and trust; imports offer authenticity and range; online brands can acquire data and test quickly. No single archetype establishes that an unoccupied market position exists.
The proposed Saffron Route position combines regional Indian flavour, recognised halal certification, consistent availability and a price index of 115–125 against a local mass brand at 100. The package places Indian imports at 130–170 and local frozen roti at 95–110. These indicative indices require a like-for-like shelf audit across pack weights, retailer formats, promotions and product categories. They are strategic hypotheses, not verified current competitor prices.
Launch with 8–10 SKUs so the distributor can establish availability and replenishment before the range grows. Track contribution after promotions, returns and cold-chain costs by SKU and channel. If the price premium is unsupported by repeat demand, improve assortment, pack size or sourcing economics before broadening distribution. The original case’s claim that the proposition beats both imports and local brands must be earned through these tests.
Swipe horizontally to view all columns.
| Archetype | Indicative price index | Proposed response |
|---|---|---|
| Local curry and spice brands | 100 | Differentiate regional Indian range while matching availability |
| Multinational cooking aids | 110–130 | Test whether flavour specificity supports switching |
| Local frozen roti/paratha | 95–110 | Prove ready-meal breadth and reliable cold-chain service |
| Indian imports | 130–170 | Test a lower import premium with steadier replenishment |
| Local snack leaders | 90–110 | Target a clear namkeen use case rather than general snacking |
| Saffron Route proposal | 115–125 | Validate authenticity, halal trust and value together |
Local mass brand = 100. Indices are supplied-study judgements, not independently verified price observations.
Source: Market Assessment, section 4; Executive Recommendation Deck, slides 7–8.
Treat market access and distributor capability as launch gates
The source package identifies halal recognition, food safety and labelling, product-specific import duties and taxes, distribution licensing, and currency exposure as diligence workstreams. In this case, halal trust is central to the mainstream positioning, so certification cannot be deferred until after the range and channel plan are fixed. Product formulations, plant documentation, packaging and the proposed importer must be reviewed together.
These are requirements to investigate with qualified local advisers, rather than legal conclusions reproduced from a historical deck. Confirm the applicable certification pathway, permitted pack claims, labelling obligations, HS-code treatment and importer/distributor licences for the actual products. The deck’s references to regulatory developments and specific recognised-body counts have not been refreshed for this website.
Distributor selection should test listing access, active outlets, replenishment service, stock ageing, payment terms, cold-chain capability and reporting quality. The case proposes performance-linked terms, an 18-month exclusivity period conditional on volume, and quarterly reviews. Those mechanisms are valuable only if the agreement defines productive doors, sales-through evidence, data access and remedies for underperformance. Retailer payment terms of 60–90 days in the assessment also need reconciliation with the model’s simplified 15% net-working-capital assumption.
A distributor plus owned digital layer balances reach and control
The case evaluates direct ownership, a distribution partner, a 51:49 joint venture and digital-first entry, then combines distributor reach with a controlled digital and foodservice layer. Direct entry offers control but carries an assumed MYR 4.5 million Year-1 fixed operating cost before sufficient scale. The joint venture shares investment and local capability but adds governance complexity. Digital-first is an efficient test channel, while its restricted scale and acquisition costs leave it loss-making under the modelled path.
The financial workbook ranks the hybrid highest at MYR 11.78 million NPV and 4.55 out of 5 on the weighted scorecard. Distribution alone remains slightly positive at MYR 0.86 million, so it is a credible lower-complexity alternative. The financial return criterion has 30% weight; speed, capital at risk, control and local knowledge each have 15%; optionality has 10%. Apart from the NPV-derived financial score, ratings and weights are judgement inputs.
This comparison is directional. The four standalone modes use a simplified model that taxes positive EBITDA without depreciation shields or loss carryforwards, while the hybrid uses the detailed scenario model. Revenue ramps, margins and costs also differ. Before a real commitment, rebuild all options on a consistent tax, cash-flow and terminal-value basis. The source evaluation table labels the hybrid’s 13% as EBITDA margin; the workbook gives 14.8% EBITDA and 12.7% EBIT, which are separated below.
Swipe horizontally to view all columns.
| Mode | NPV (MYR m) | Peak funding (MYR m) | Y5 revenue (MYR m) | Y5 EBITDA margin | Score / 5 |
|---|---|---|---|---|---|
| Direct subsidiary | −20.04 | 24.69 | 30.07 | 3.7% | 2.10 |
| Distribution partner | 0.86 | 6.59 | 28.56 | 10.3% | 3.64 |
| Joint venture (51% share) | −9.33 | 10.88 | 31.57 | 8.1% | 2.95 |
| Digital-first | −6.26 | 8.09 | 15.03 | −1.3% | 3.27 |
| Partner-led hybrid | 11.78 | 8.35 | 30.05 | 14.8% | 4.55 |
NPV includes terminal value. JV funding and value reflect Saffron Route’s 51% share; revenue is the modelled entity’s revenue. Hybrid and standalone valuation methods differ.
Source: Financial workbook, Mode_Compare B21:B26/B45:B50/B69:B74/B93:B98; Model_Base B85/B88/H27/H46; Entry_Scorecard C10:G10.
Translate the market ambition into productive outlets and customer cohorts
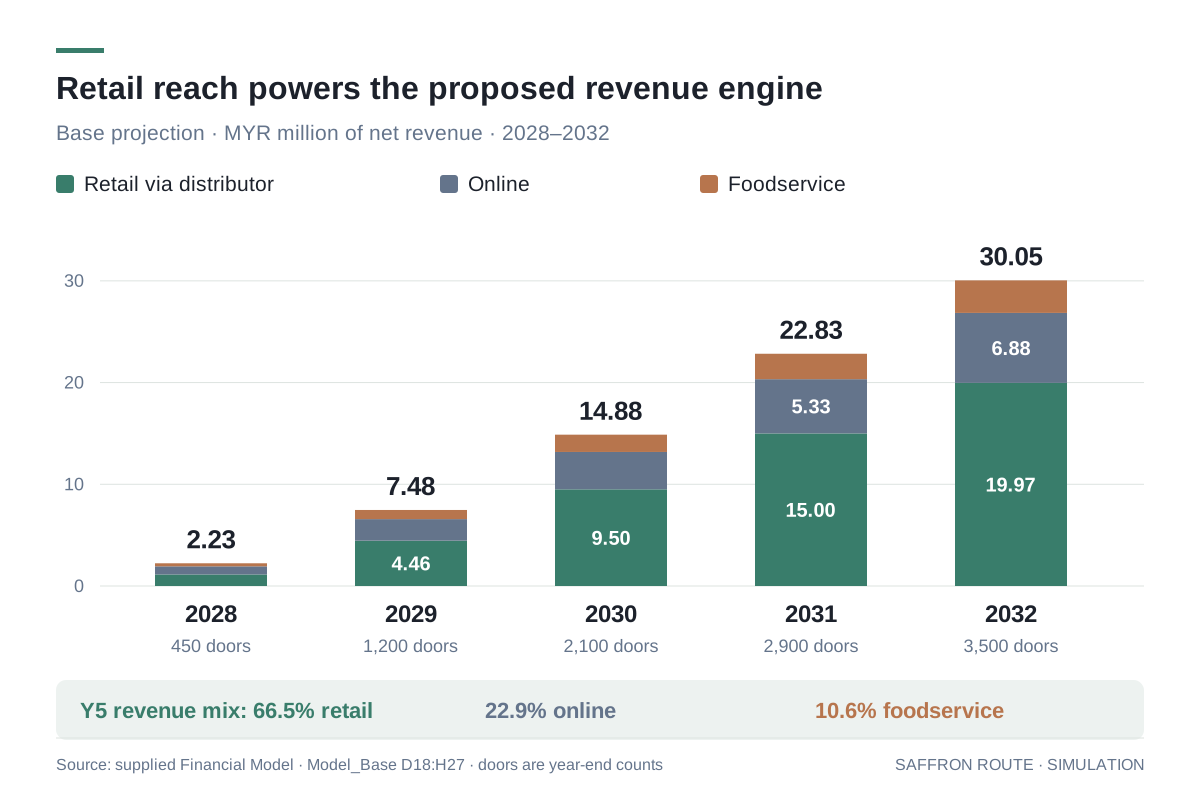
Retail revenue is built from average active doors, monthly net sales per door and twelve months of trading. The base plan rises from 450 doors at the end of Year 1 to 3,500 at the end of Year 5. Using opening and closing door counts, average doors rise from 225 to 3,200. Monthly net sales per door improve from MYR 420 to MYR 520. Together they produce MYR 1.13 million of retail revenue in 2028 and MYR 19.97 million in 2032.
Online revenue is a cohort build: the prior year’s active customers are retained at 45%, then new customers are added. New acquisition grows from 5,000 to 28,000 customers per year. At 3.2 annual orders and a MYR 50 average order value, active customers reach approximately 43,000 and online revenue reaches MYR 6.88 million in Year 5. Foodservice is a separate judgement-based revenue series, growing from MYR 0.30 million to MYR 3.20 million.
The resulting MYR 30.05 million Year-5 revenue mix is 66.5% retail, 22.9% online and 10.6% foodservice. These drivers make accountability clearer than a market-share target alone: track listed versus genuinely active outlets, per-door throughput, order frequency, repeat purchase, acquisition cost and foodservice contract quality. Retail scale is the dominant revenue engine; online adds data and margin only when retention and fulfilment assumptions hold.
Swipe horizontally to view all columns.
| Driver | 2028 · Y1 | 2029 · Y2 | 2030 · Y3 | 2031 · Y4 | 2032 · Y5 |
|---|---|---|---|---|---|
| Doors at year end | 450 | 1,200 | 2,100 | 2,900 | 3,500 |
| Average active doors | 225 | 825 | 1,650 | 2,500 | 3,200 |
| Monthly sales / door (MYR) | 420 | 450 | 480 | 500 | 520 |
| Retail revenue (MYR m) | 1.13 | 4.46 | 9.50 | 15.00 | 19.97 |
| Online revenue (MYR m) | 0.80 | 2.12 | 3.67 | 5.33 | 6.88 |
| Foodservice revenue (MYR m) | 0.30 | 0.90 | 1.70 | 2.50 | 3.20 |
| Total revenue (MYR m) | 2.23 | 7.48 | 14.88 | 22.83 | 30.05 |
Source: Financial workbook, Assumptions D33:H37; Model_Base D18:H27. Rounded components may not sum exactly.
Figure 3. Productive doors drive the proposed MYR 30.05m revenue engine
Retail revenue uses average doors × monthly net sales × 12. Online uses retained customers plus new acquisition, multiplied by annual orders and order value. Foodservice is a separate revenue assumption.
Interpretation: All years are projections. The model assumes 45% annual customer retention and MYR 420–520 monthly net sales per retail door.
Source: Financial Model, Model_Base D18:H27; Assumptions D33:H37/B16:B18.
Separate attractive gross margins from durable customer contribution
The hybrid assumes gross margins of 38% on distributor-served retail, 55% online and 30% in foodservice. Its Year-5 blended gross margin is 41.0%. Online’s higher gross margin is reduced by an 18% revenue charge for marketplace commission and fulfilment, plus acquisition costs. Trade and brand expenditure, distribution logistics, local staffing, compliance and working capital remain material even when the route to market is asset-light.
The workbook estimates customer lifetime contribution as MYR 160 annual customer revenue multiplied by a 37% margin after COGS and marketplace fulfilment, divided by one minus 45% annual retention. This produces MYR 107.64 of undiscounted lifetime contribution. Against the Year-3 acquisition-cost assumption of MYR 28, LTV/CAC is 3.84 times. It excludes allocated local-team and compliance costs, ignores discounting and assumes retention stays constant; it is a screening metric, not proof of lifetime profitability.
The proposed online gates are CAC at or below MYR 35 and LTV/CAC of at least 3 times. Measure them using observed cohorts, refunds and repeat orders before expanding paid acquisition. On the wider business, EBIT first becomes positive in Year 3 by only MYR 0.012 million. That narrow cushion makes modest cost or throughput misses consequential even though the milestone reads as operating break-even.
The source’s MYR 13.75 million Year-5 break-even revenue divides fixed operating costs by contribution margin and excludes depreciation. It is an EBITDA-level threshold, with a 54.2% margin of safety relative to projected revenue. Including the model’s MYR 0.64 million depreciation raises the comparable EBIT threshold to approximately MYR 16.10 million, assuming the same mix and variable-cost ratios. Cash payback is a separate question, addressed next.
Positive terminal value does not remove the five-year cash deficit
The 2027 set-up combines MYR 1.20 million of pre-launch expenses with MYR 0.80 million of capex, giving MYR 2.00 million of initial cash outflow. The base model then spends more cash than it generates through Year 3, when cumulative free cash flow reaches a MYR 8.35 million deficit. Annual free cash flow turns positive in Year 4, but the cumulative position remains negative by MYR 5.02 million at the end of Year 5. Cash payback is not achieved within the modelled operating period.
At a 12% discount rate, the explicit set-up and five-year cash flows have an NPV of negative MYR 5.25 million. A 3% perpetual-growth assumption applied to Year-5 free cash flow creates MYR 30.01 million of terminal value, worth MYR 17.03 million today. This lifts total base NPV to MYR 11.78 million. Terminal value contributes 144.5% of that net result because the explicit period destroys discounted value.
A separate five-times Year-5 EBITDA exit value reduces base NPV to MYR 7.36 million. The model’s 44.3% perpetual-growth IRR and 34.9% exit-multiple IRR both depend on those terminal receipts. Neither is a realised return or evidence that initial capital has already been repaid. A real investment case should normalise cash taxes after loss utilisation, maintenance capex, working-capital growth, disposal costs and any debt before relying on terminal economics.
Swipe horizontally to view all columns.
| Measure | 2027 · Y0 | 2028 · Y1 | 2029 · Y2 | 2030 · Y3 | 2031 · Y4 | 2032 · Y5 |
|---|---|---|---|---|---|---|
| Revenue | 0.00 | 2.23 | 7.48 | 14.88 | 22.83 | 30.05 |
| EBITDA | −1.20 | −1.61 | −1.04 | 0.43 | 2.40 | 4.44 |
| EBIT | −1.20 | −1.77 | −1.30 | 0.01 | 1.86 | 3.80 |
| Free cash flow | −2.00 | −2.44 | −2.63 | −1.28 | 0.71 | 2.62 |
| Cumulative free cash flow | −2.00 | −4.44 | −7.07 | −8.35 | −7.64 | −5.02 |
Free cash flow is EBITDA less cash tax, capex and the change in net working capital. Terminal value is excluded from the cash balances shown.
Source: Financial workbook, Model_Base C27:H27/C45:H49/C60:H61; Summary B23:G28.
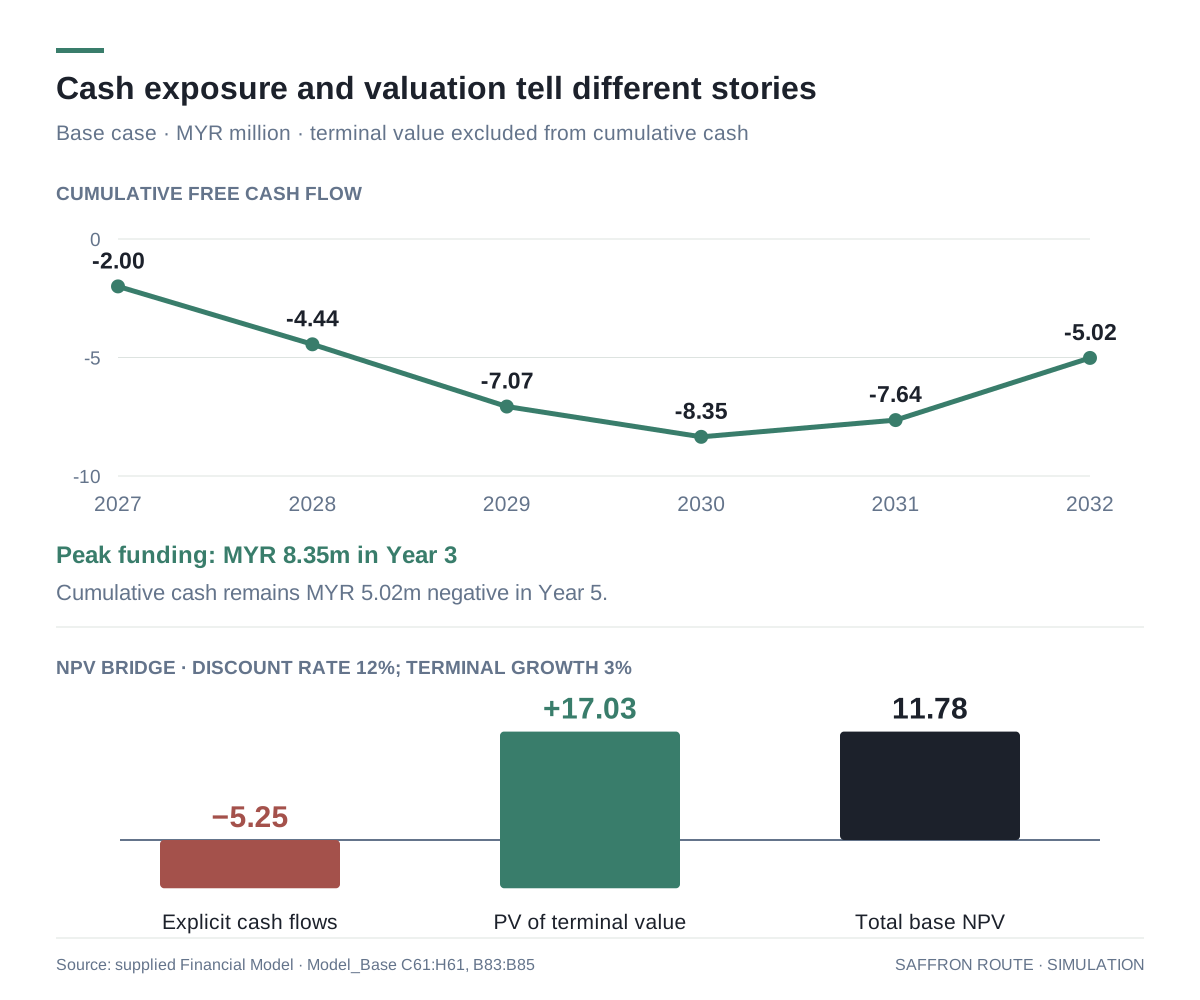
Figure 4. The base case stays cash-negative through Year 5 and depends on terminal value
Cumulative cash excludes terminal value. The valuation bridge uses a 12% discount rate and 3% perpetual growth; the five-times EBITDA exit-multiple cross-check gives MYR 7.36m NPV.
Interpretation: Terminal value is 144.5% of base NPV. Positive valuation and positive annual cash flow do not establish cumulative cash payback within the five-year operating horizon.
Source: Financial Model, Model_Base C61:H61/B83:B85/B94; Assumptions B7:B11.
Distribution execution drives the downside and the investment gates
The bear case combines 35% slower door rollout, 20% lower sales per door and foodservice volume, 30% fewer online new customers, 25% higher CAC, 8% higher COGS, 20% higher trade spend and 10% higher fixed costs. A launch-delay factor halves Year-1 revenue. Year-5 revenue falls to MYR 17.76 million, EBIT remains negative and cumulative funding reaches MYR 15.66 million. Terminal value is floored at zero; this is a five-year continuation case, not a model of an early managed exit.
The bull case combines stronger distribution and customer acquisition with lower costs. It reaches MYR 38.48 million Year-5 revenue, 18.7% EBIT margin and MYR 26.32 million NPV including terminal value. Judgement weights of 25% bear, 50% base and 25% bull produce MYR 9.44 million expected NPV, or MYR 5.77 million on the exit-multiple basis. The weighted explicit-period NPV remains negative MYR 6.09 million. Probabilities are planning choices rather than estimated frequencies from observed outcomes.
The supplied sensitivity table changes one driver at a time. WACC produces the widest NPV range, from MYR 7.51 million at 14% to MYR 18.72 million at 10%. Among operating levers, sales per door and foodservice volume, door rollout and landed COGS dominate. A 20% throughput reduction cuts NPV to MYR 5.60 million; 20% slower rollout gives MYR 6.45 million; 5% higher COGS gives MYR 6.94 million. These tests justify proving outlet productivity and landed economics before funding geographic expansion.
All twenty saved sensitivity endpoints and the scenario cash-flow series were independently reconstructed from the supplied assumptions and matched within rounding tolerance. The workbook’s sensitivity endpoints are nevertheless pasted values: they do not update automatically when inputs change. SAM and SOM are also pasted into the financial workbook. Rerun sensitivities and refresh those cross-workbook inputs after validation; isolated sensitivities do not replace a combined stress scenario.
Swipe horizontally to view all columns.
| Metric | Bear | Base | Bull |
|---|---|---|---|
| NPV with terminal value (MYR m) | −12.14 | 11.78 | 26.32 |
| NPV with exit multiple (MYR m) | −12.14 | 7.36 | 20.50 |
| Explicit-period NPV (MYR m) | −12.14 | −5.25 | −1.73 |
| Year-5 revenue (MYR m) | 17.76 | 30.05 | 38.48 |
| Year-5 EBIT margin | −6.2% | 12.7% | 18.7% |
| Peak funding (MYR m) | 15.66 | 8.35 | 6.27 |
| Operating break-even | After Y5 | Y3 | Y3 |
| Cash payback | After Y5 | After Y5 | Y5 |
| Judgement probability | 25% | 50% | 25% |
All values are projections. The bear case continues for the full model horizon; the proposed stage gates do not automatically limit these losses.
Source: Financial workbook, Summary B5:D15, Assumptions B27:B29/B48:D55; independently checked against underlying formulas and cached values.
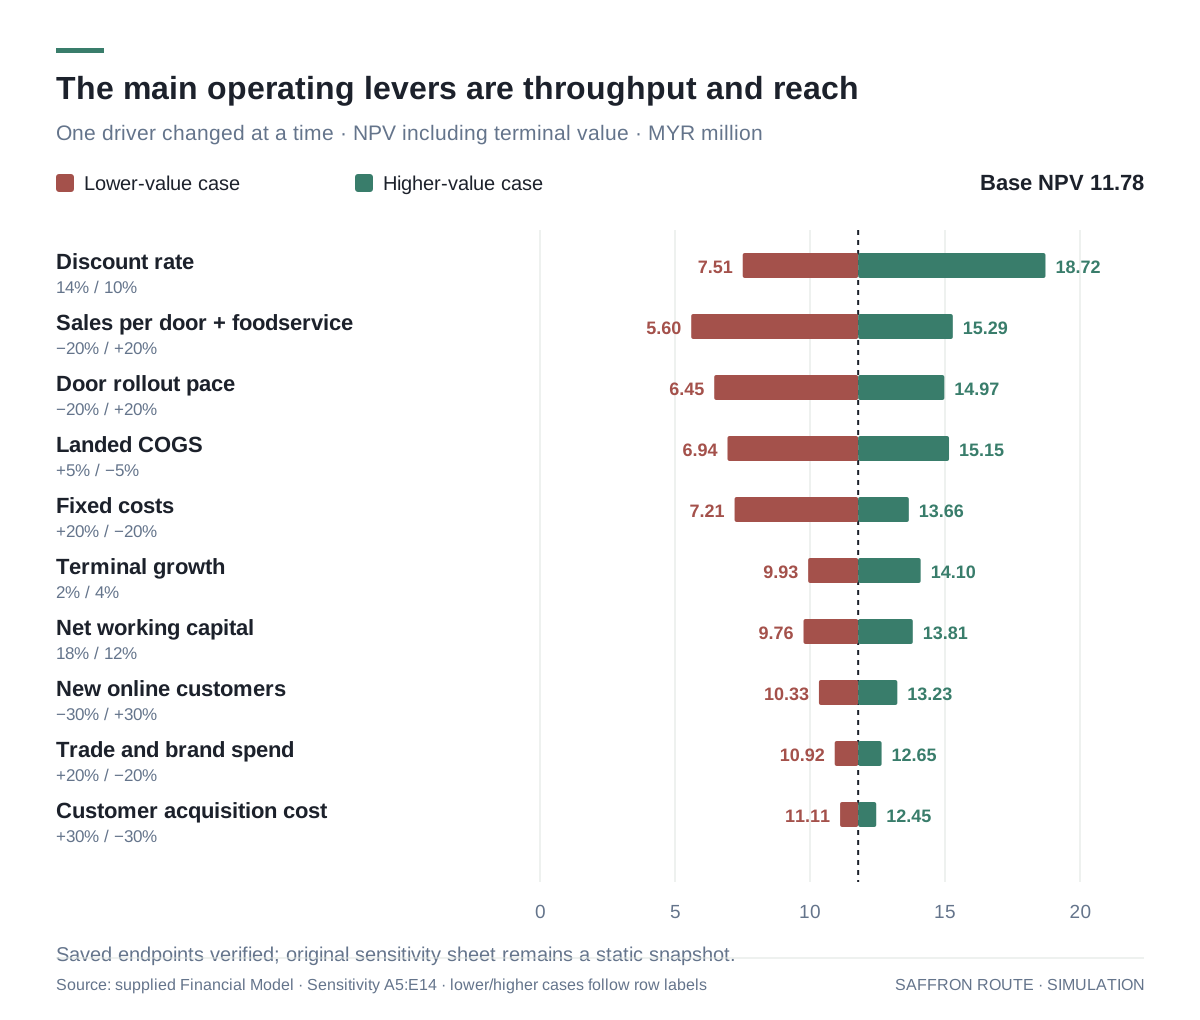
Figure 5. Throughput, rollout and landed costs dominate the operating sensitivities
The chart reproduces the ten supplied one-driver sensitivity tests. Their twenty endpoints were independently reconstructed and matched to the saved results. Lower-value and higher-value changes are shown around the MYR 11.78m base NPV.
Interpretation: Sensitivity values are static snapshots in the original workbook, not live Excel data tables. They must be rerun after assumptions change; combined stress effects are assessed separately through the scenarios.
Source: Financial Model, Sensitivity A5:E14 and Assumptions; independent read-only reconstruction of the base model.
Release capital against evidence, with an explicit stop or resize decision
Phase 0 uses the proposed MYR 1.20 million validation budget to resolve certification, product and packaging requirements, shelf pricing, consumer demand and distributor terms. The first 90 days focus on regulatory advisers, the 600-person survey, an RFP to three distributors and a limited marketplace pilot. The gate is a signed and operationally credible route to market plus updated assumptions, rather than elapsed time alone. The additional MYR 0.80 million set-up capex belongs to a later approved commitment within the model’s MYR 2.00 million Year-0 cash requirement.
Launch concentrates on Klang Valley and Johor, approximately 450 year-end doors, 8–10 SKUs, online storefronts and a small foodservice pilot. Proposed gates are at least 300 doors by Month 9, monthly net sales per door of MYR 400 or more and CAC at or below MYR 35. The base model already implies MYR 4.44 million cumulative cash exposure by the end of Year 1; these checkpoints need enough lead time to change spending before commitments become unavoidable.
Years 2–3 expand toward 2,100 doors, Penang and Negeri Sembilan, a cold-chain range and larger foodservice accounts. At least 1,200 doors by Month 24 and EBIT near break-even in Year 3 support continuation. Years 4–5 consider local co-packing, a joint venture or a subsidiary only after a sustained margin and service record. Gross margin above 40% and EBIT margin above 10% are proposed review gates, not automatic triggers for ownership changes.
The financial model does not contain a stop-loss algorithm, restructuring cost or exit recovery schedule. The investment committee should therefore specify the owner, review date, cash ceiling and stop-or-resize response for every gate. Freeze low-productivity rollout, reduce paid acquisition or narrow the range when validated economics deteriorate, then reforecast the cash requirement before approving another tranche.
What the case establishes, and what still needs field evidence
The completed analytical output is a linked decision package: a market assessment, a transparent sizing model, an entry-mode comparison, scenario economics and a staged roadmap. Its strength is making the dependencies visible. Segment choice affects certification and assortment; distribution determines productive doors; customer retention affects online contribution; those drivers flow through operating costs, working capital and valuation.
The package does not include primary customer research, distributor bids, confirmed retail listings, verified competitor price observations or signed certification approvals. Its consumer-spend assumptions and price indices need field validation. Its tax, licensing and regulatory references require professional review. Source-labelled confidence in demographic inputs is preserved as a statement about the study, without independently endorsing those external references here.
The downloadable originals preserve the model formulas and the author’s source notes. The website’s analytical charts are reconstructed from supplied workbook values, and the companion CSVs provide tidy extracts with worksheet references. They make the calculations inspectable while retaining the central limitation: a fictional company and prospective model cannot demonstrate implemented revenue, savings, market share or investment returns.
Strategic priorities
Approve validation before the full expansion envelope
Use the proposed MYR 1.20m Phase-0 budget to replace spend, affinity, pricing and partner assumptions. Reconcile regulatory readiness and the complete MYR 2.00m Year-0 cash requirement before launch capex is committed.
Contract for productive distribution and usable data
Tie exclusivity and incentives to active doors, sell-through, stock quality and reporting. Preserve digital customer access and independently monitor outlet throughput, retention and contribution.
Rebuild the investment comparison on consistent cash economics
Align tax treatment, terminal assumptions and revenue scope across modes; normalise terminal cash flow; refresh cross-workbook inputs and sensitivity snapshots after each validation round.
Give each gate a cash ceiling and a stop decision
Assess door pace, MYR 400+ monthly throughput, CAC ≤ MYR 35 and cohort contribution before releasing the next tranche. Model early exit and recovery explicitly before claiming that gates cap downside.
Path to implementation
Proposed sequencing and decision gates.
Phase 0 · Up to 6 months · Proposed
Validate demand and market access
Commission the shelf audit and consumer survey, confirm product compliance, shortlist three distributors and run a small digital pilot within the proposed MYR 1.20m validation budget.
Decision gate: Certification pathway and launch approvals confirmed; distributor terms signed; price acceptance and core model assumptions supported by field evidence.
Year 1 · 2028 · Proposed
Prove the focused launch
Launch 8–10 SKUs in Klang Valley and Johor with retail, controlled digital stores and a foodservice pilot. The base model targets 450 year-end retail doors.
Decision gate: At least 300 doors by Month 9, monthly net sales per door ≥ MYR 400, CAC ≤ MYR 35, and an updated cash forecast within the approved envelope.
Years 2–3 · 2029–2030 · Proposed
Scale demonstrated outlet economics
Expand into additional priority regions and frozen distribution, targeting 2,100 year-end doors by Year 3 while reviewing partner service and customer cohorts.
Decision gate: At least 1,200 doors by Month 24; EBIT near break-even in Year 3; evidence supports further expansion despite the projected MYR 8.35m peak base cash requirement.
Years 4–5 · 2031–2032 · Proposed
Review localisation and ownership
Assess local co-packing or a joint venture against the proven distributor model, including landed costs, governance, cold-chain requirements and incremental capital.
Decision gate: Sustained gross margin > 40% and EBIT margin > 10%, with a consistent comparative investment case and a credible route to cumulative cash recovery.
Value and measurement
The case delivers a proposed partner-led entry strategy, a bottom-up market-sizing framework, three financial scenarios, a five-option evaluation and an evidence-based funding roadmap. Workbook-derived projections are independently reconciled and the valuation dependence on terminal value is explicit. No launch, customer contract, realised revenue, realised return or operational implementation is claimed.
Explore the evidence
Datasets & further reading
Download the source material to explore the analysis, inspect model assumptions, and read the full study.
Complete Saffron Route study package
All original reports, Excel models, presentation and source README, plus the two derived CSV extracts.
ZIP · 174 KB
- Download DOCX, 15 KB
Market assessment
Original report covering demand, consumer segments, competition and market-access diligence.
Report · DOCX · 15 KB
- Download XLSX, 17 KB
Market-sizing dataset and model
Original Excel assumptions, segment calculations, TAM/SAM/SOM funnel and source notes.
Dataset · XLSX · 17 KB
- Download DOCX, 17 KB
Entry-strategy evaluation
Original comparison of entry modes, financial case, risks and proposed roadmap.
Report · DOCX · 17 KB
- Download XLSX, 53 KB
Financial and scenario model
Original Excel formulas, three scenarios, entry scorecard and static sensitivity snapshots.
Model · XLSX · 53 KB
- Download PPTX, 98 KB
Executive recommendation deck
Original 15-slide investment narrative and staged-entry recommendation.
Presentation · PPTX · 98 KB
- Download CSV, 3 KB
Market-sizing data in CSV
Readable segment and funnel extracts, with model units and worksheet references.
Dataset · CSV · 3 KB
- Download CSV, 17 KB
Financial-scenario data in CSV
Bear, base and bull yearly revenue, profit, cash flow and valuation outputs with worksheet references.
Dataset · CSV · 17 KB
Sources and scope
Saffron Route Foods is fictional. Market references belong to the supplied October 2026 study and were not independently refreshed. Spend, affinity, growth, prices, margins, retention, acquisition cost, distributor terms and scenario weights include judgement assumptions. Consumer SAM and financial revenue have different scopes; standalone modes and the hybrid have different valuation methods. Sensitivity endpoints and cross-workbook SAM/SOM inputs are static. Stage gates are proposed and not embedded as early-stop mechanics in the bear case.
Market Assessment · Original report
Company scope, market attractiveness, category and segment hypotheses, competitive archetypes, regulatory diligence and evidence-quality assessment.
Market Sizing Model · Original workbook
Assumptions, Segments, Funnel, TopDown_Check and Sources sheets. Formula and cached-value audit supports the MYR 429.29m SAM and MYR 30.07m sizing target.
Entry Strategy Evaluation · Original report
Entry alternatives, economics, staged roadmap, sensitivity interpretation, risks and first-90-day priorities. Metric labels are reconciled to workbook definitions in this article.
Financial Model · Original workbook
Summary, Assumptions, three scenario models, Mode_Compare, Entry_Scorecard and Sensitivity. Scenario cash flows and all twenty sensitivity endpoints independently reconstructed from source inputs.
Executive Recommendation Deck · Original presentation
Fifteen slides, October 2026. Explicitly identifies the company as fictional; contains the strategic narrative, model outputs and proposed investment decision.
Continue reading
Related case studies
ERP investment / Operations transformation / Financial modelling
Meridian Precision Components: Make the ERP earn its place
A process-first manufacturing transformation strategy that tests an ERP investment against operational evidence, working-capital economics and production risk.
Market entry / Enterprise software / Investment modelling
Malaysia ERP market entry: a stage-gated partnership
A market-entry assessment for an illustrative Indian software company, connecting market sizing and customer focus to a conditional, capital-gated investment case.

Market entry / Investment strategy / Risk management
Build CtrlS’s Malaysia entry around contracted demand
A market-entry strategy that connects customer selection, infrastructure readiness and staged capital commitments for a proposed Cyberjaya facility.