Market entry / Enterprise software / Investment modelling
Malaysia ERP market entry: a stage-gated partnership
A market-entry assessment for an illustrative Indian software company, connecting market sizing and customer focus to a conditional, capital-gated investment case.
The recommendation
Prove the partner motion before releasing the full market-entry budget.
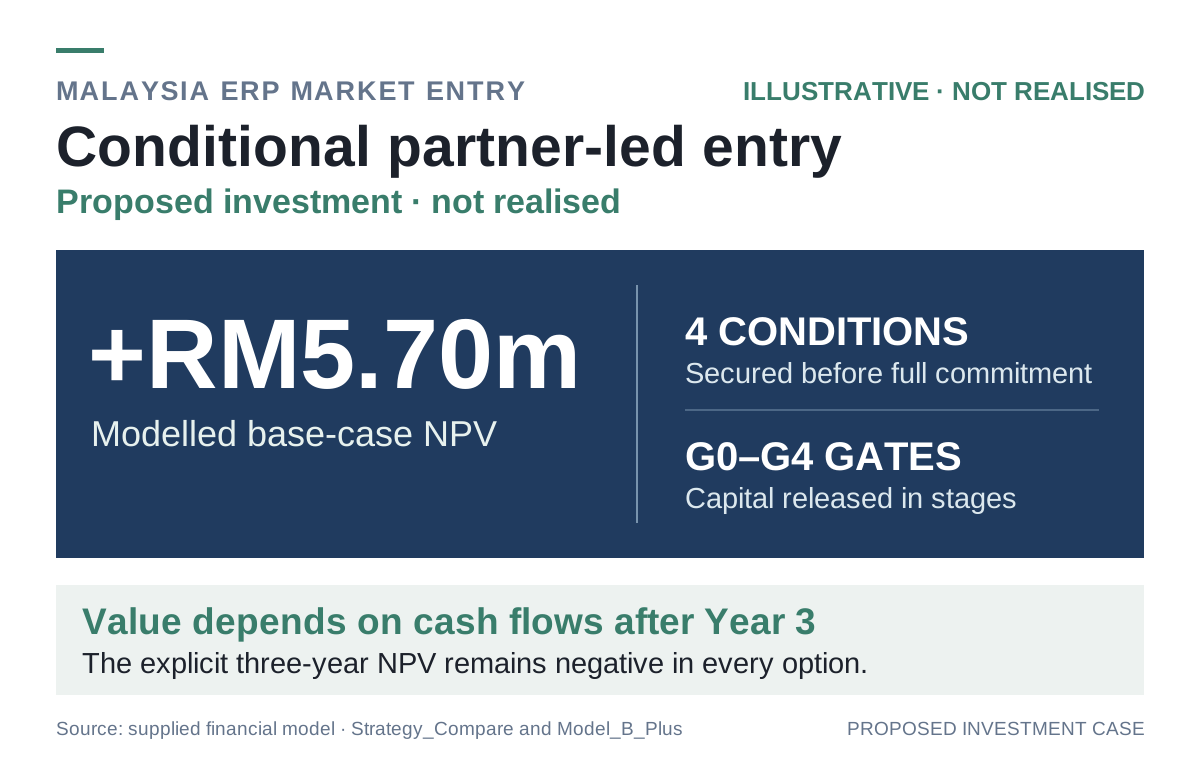
The supplied analysis favours a local systems-integrator partnership over a direct subsidiary or broad distributor network, but the partnership as initially modelled misses the 12% investment hurdle. Four conditions—reusable localisation, stronger partner co-selling, price discipline and an operating-cost cap—produce a conditional Option B+ with a modelled RM5.70 million base NPV and RM6.84 million peak cash requirement. Its first three years have negative RM6.01 million NPV; the positive result depends on later cash flows and terminal value. The decision is therefore to validate demand, secure an accountable anchor partner and release capital against evidence, while refreshing the model for the current e-invoicing threshold and actual client economics.
Decision at stake
Whether an Indian ERP vendor should enter Malaysia, which route provides credible mid-market access, and what proof must precede each investment tranche.
Prepared in October 2026 for a representative Indian cloud-ERP vendor because no real client data was supplied. The original package contains a 29-page report, a two-page board recommendation, a 16-sheet Excel model and 15 supporting charts. All commercial outcomes, valuations and stage gates are proposed or modelled, not achieved.
Evidence and decision parameters
- Conditioned base NPV
- RM5.70m
- Illustrative Option B+ at a 12% discount rate, including Year 4–6 cash flows and terminal value; not an achieved return.
- First three years' NPV
- −RM6.01m
- Discounted set-up and Years 1–3 free cash flow before later value; the central investment dependency.
- Peak base cash at risk
- RM6.84m
- Modelled cumulative funding trough at the end of Year 3; the RM12m risk limit in the source is only a placeholder.
- Year-3 customer target
- 349
- Projected closing logos behind RM6.25m net ARR; partner productivity and retention remain untested.
Turn a broad market opportunity into a fundable decision
The reference client is an invented mid-sized Indian vendor with cloud-capable finance, inventory, manufacturing and payroll software, an established India e-invoicing engine and no Malaysian presence. There are no supplied client accounts, customer interviews, distributor bids or signed contracts. The source package is a feasibility simulation, so its prices, sales capacity, costs, RM12 million risk appetite and investment results must be replaced before any real commitment.
The assessment links seven workstreams: market sizing, a ten-vendor capability benchmark, an eleven-vertical segment score, regulatory diligence, three entry modes, a driver-based financial model and a 26-risk register with funding gates. Four versions of the model—direct entry, local partnership, distributor-led entry and a conditioned partnership—make the recommendation testable rather than resting on a market-growth headline.
The completed work is a board decision package, not a launched business. The recommendation remains conditional even under its own assumptions: none of the three unmodified entry modes produces positive base NPV at the model's 12% hurdle. The four proposed improvements create a potential route to value, but two of them depend directly on partner behaviour and customer willingness to pay.
Narrow a large software-spend estimate to contestable demand
The source starts with 1,101,725 Malaysian micro, small and medium enterprises recorded for 2023. It projects the establishment base forward at an assumed 2.4% annual rate, then applies size-class filters for ERP-relevant sectors, ERP-grade need and annual software spend. This yields a modelled RM1,452 million 2026 total addressable spend pool. The 2026 firm count of 1,220,813 in the workbook includes an estimated large-firm tier; it should not be presented as a current official MSME count.
Product-fit and 55% geographic-reach assumptions narrow that pool to RM478 million of serviceable annual spend. A further 12% assumption for new buyers or replacement decisions produces RM57.4 million of annual contestable demand. These percentages are consultant judgements, not measured purchase incidence or confirmed addressable revenue. In particular, the three-corridor reach estimate includes an assumed Penang/Melaka share and should be checked against the actual customer and partner map.
At a further assumed 9% annual market-growth rate, the model reaches RM619 million SAM by 2029. It compares Option B+'s projected RM6.25 million Year-3 net annual recurring revenue with about RM205 million of cumulative 2027–29 contestable demand, reporting 3.1%. That calculation is a planning ratio across different time bases, not a conventional annual market-share claim. The practical test is whether a small, reachable set of mid-market buyers will pay for the proposed depth and implementation quality.
Swipe horizontally to view all columns.
| Layer | RM million | Basis and decision meaning |
|---|---|---|
| Total addressable spend | 1,452 | Projected establishments × sector/need filters × assumed spend |
| Serviceable spend | 478 | Product-fit filters and 55% geographic reach |
| Annual contestable pool | 57.4 | Serviceable spend × assumed 12% new-buyer/replacement rate |
| Option B+ Year-3 net ARR | 6.25 | Projected closing subscription run-rate, not realised sales |
The first three rows are 2026 market estimates; the final row is a proposed Year-3 company target and is not a subset measured from those market layers.
Source: Original report pp. 7–8; financial workbook, Market_Sizing and Model_B_Plus sheets.
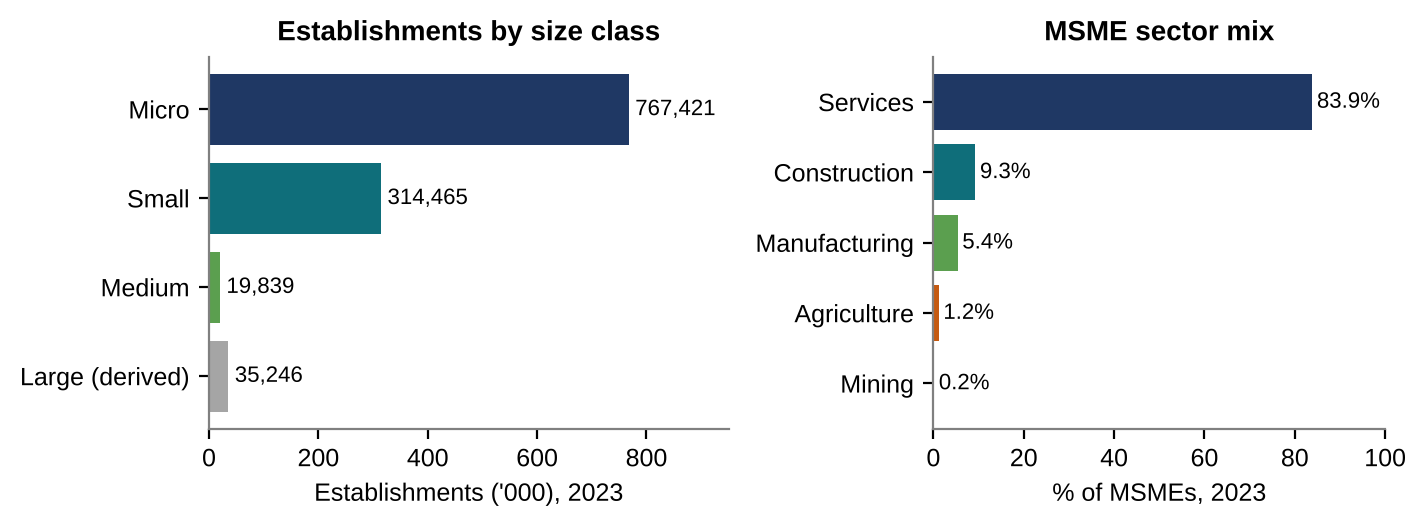
Figure 1. The establishment base is large, but most firms are micro-sized
Historical establishment counts set the starting population for the model. The illustrative client still needs to narrow that base by ERP need, ability to pay, product fit and reachable geography.
Interpretation: The source report's later market opportunity is a modelled estimate, not a direct count of addressable software buyers.
Source: Supplied consulting report, Figure 1; DOSM Economic Census 2023 via SME Corp as cited in the report. Large-firm count is derived from the reported MSME share.
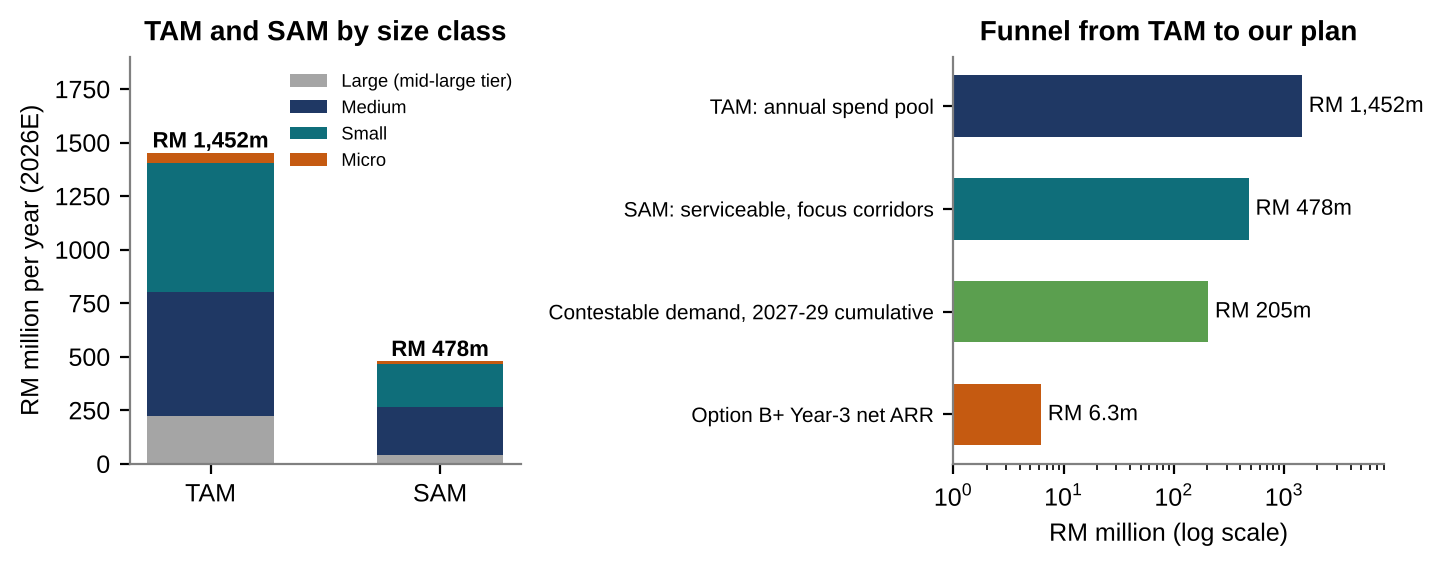
Figure 2. The model narrows RM1,452m of annual spend to a RM478m serviceable market
The funnel applies consultant assumptions for vertical relevance, ERP readiness, product fit, geography, spend per firm and replacement demand. Its layers mix annual spend, three-year cumulative demand and a Year-3 ARR target, so they are not directly comparable shares.
Interpretation: The establishment baseline is sourced; conversion percentages and customer spend are judgement inputs that require validation with buyers and partners.
Source: Supplied consulting report, Figure 2; financial workbook, Market_Sizing and Model_B_Plus sheets.
Choose mid-market depth over a mass-SME price fight
The report places established Malaysian accounting suites such as AutoCount and SQL Account at the lower end of the market, premium SAP and Microsoft partner solutions at the upper end, and cloud alternatives including Zoho in the middle. It proposes an ERP offer for distributors and manufacturers needing multi-warehouse control, costing and statutory workflow depth at a price below premium suites. The claimed 25–40% price gap is a hypothesis drawn from public positioning and would need a like-for-like quotation exercise.
A weighted consultant benchmark scores the illustrative client at only 2.35 out of 5 on entry against AutoCount at 4.40 and SQL Account at 4.30. The proposed Year-3 client score of 3.65 assumes localisation, references and a functioning partner channel. The score is a decision aid, not an audited measure of product performance. It makes the early weakness explicit: a feature-rich product without Malaysian compliance, trust and delivery capacity is not yet a competitive offer.
The intended response is to lead with vertical workflows and partner-delivered implementations, then earn customer references. A company-owned key-account desk could follow proven mid-market demand; a low-touch distributor channel for starter customers should remain optional because it weakens pricing power and creates support load at much lower contract values.
Swipe horizontally to view all columns.
| Position | Weighted score / 5 | Interpretation |
|---|---|---|
| AutoCount | 4.40 | Strong local compliance, channel and brand position in the source benchmark |
| SQL Account | 4.30 | Established reseller reach and trading/manufacturing relevance |
| Reference client · Day 1 | 2.35 | Good product breadth, but no Malaysian channel or references |
| Reference client · Year-3 target | 3.65 | Assumes the proposed localisation and partner programme succeeds |
Seven weighted criteria; ratings and the Year-3 target are consultant judgements from public material.
Source: Original report pp. 9–10; financial workbook, Competitors sheet.
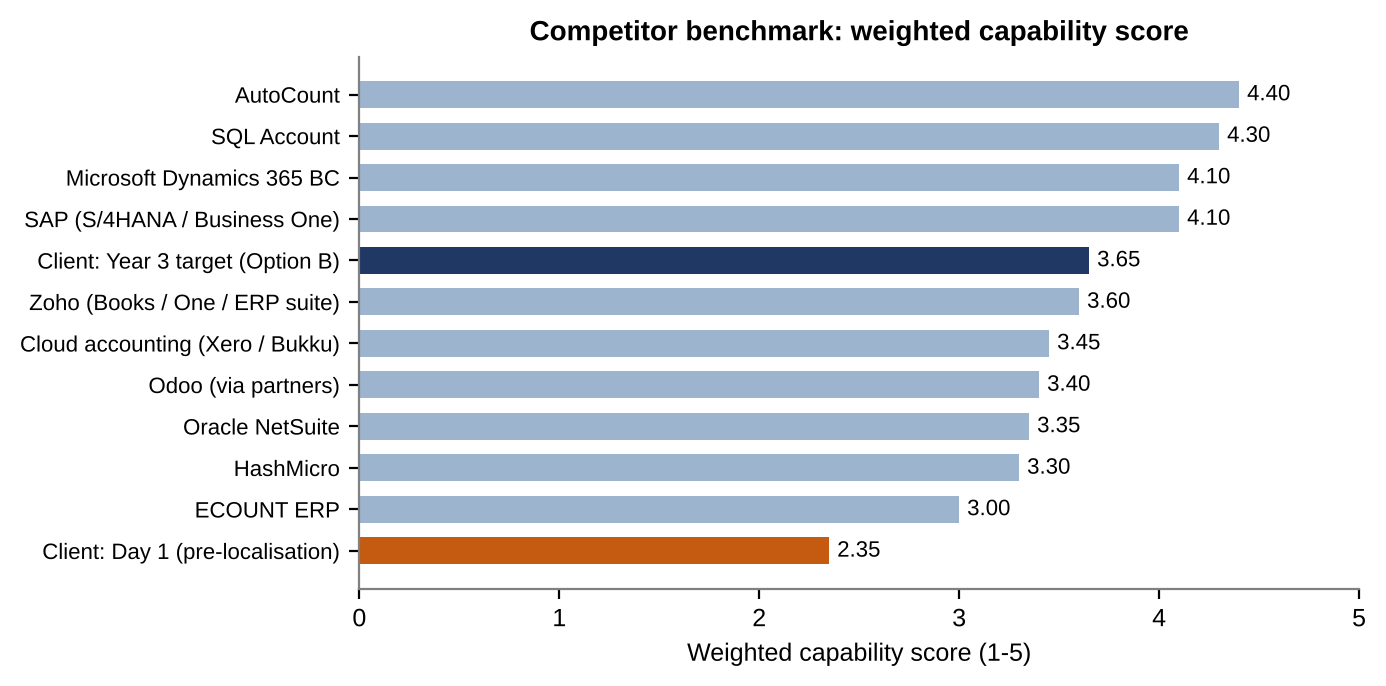
Figure 3. The proposed entrant starts behind established local suites
Seven weighted criteria combine compliance readiness, local channels, product breadth, price accessibility, brand trust, cloud capability and vertical depth. A Year-3 target is shown separately from the client's Day-1 position.
Interpretation: The scores are a planning benchmark, not independently tested product performance or verified current market rankings.
Source: Supplied consulting report, Figure 3; financial workbook, Competitors sheet. Scores are consultant judgements based on cited public positioning.
Sell to complexity in two lead verticals and three corridors
Wholesale, trading and distribution scores 4.10 out of 5 in the eleven-vertical screen; manufacturing follows at 4.05. Both have inventory, costing, multi-entity and audit-trail use cases that could justify a fuller ERP subscription. Logistics (3.55) and construction (3.35) are next-wave candidates. Retail and food service score lower because point-of-sale incumbents and price sensitivity weaken the proposed fit. These are weighted strategy scores, not surveyed conversion rates.
The initial ideal customer is a manufacturer or distributor with 30–200 staff, RM15–150 million revenue and multiple warehouses or entities, in Klang Valley, Penang or Johor. The model uses RM65,000 annual contract value for this mid-market tier, RM22,000 for Core SMEs and RM4,800 for Starter firms. All three are pricing assumptions. The first validation should test product fit, buyer authority, implementation cost, competitor alternatives and willingness to pay with actual prospects.
An anchor systems integrator should provide both qualified access and implementation capacity. The source proposes 25 customer and 10 partner interviews, a survey of roughly 150 firms and 5–8 design-partner customers with reference rights. None of these activities is documented as completed. They are the route for replacing benchmark scores and funnel percentages with field evidence before scaling a sales team.
Swipe horizontally to view all columns.
| Vertical | Score / 5 | Reason to test |
|---|---|---|
| Wholesale, trading and distribution | 4.10 | Stock, credit and multi-branch complexity; partner access is essential |
| Manufacturing | 4.05 | Costing, bills of materials and traceability needs |
| Logistics and warehousing | 3.55 | Billing-heavy workflows; second-wave candidate |
| Construction and engineering | 3.35 | Project costing, with more fragmented readiness |
Scores combine market size, ERP need, product fit, e-invoice readiness, competitive whitespace and channel access. They do not predict win rates.
Source: Original report pp. 11–12; financial workbook, Segmentation sheet.
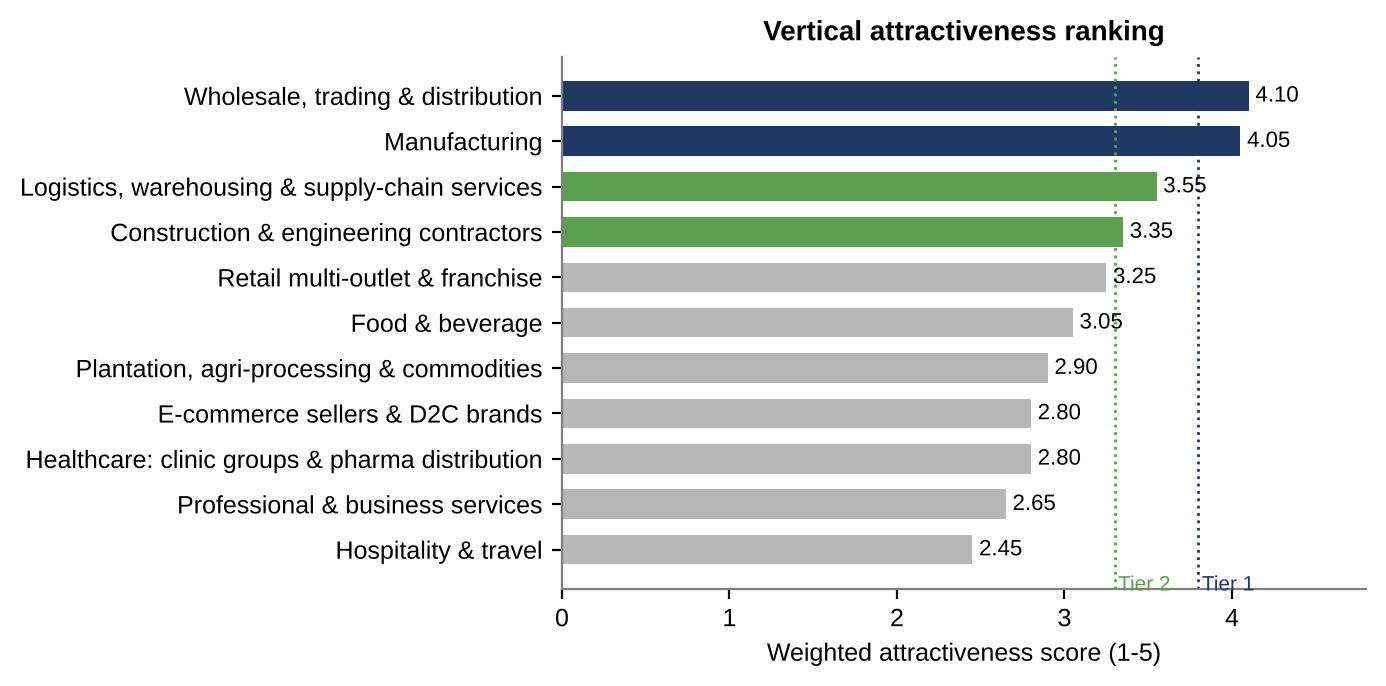
Figure 4. Wholesale and manufacturing lead the illustrative vertical screen
The screen weighs market size, ERP need, product fit, e-invoicing readiness, competitive whitespace and channel access. It helps focus initial discovery on distributors and manufacturers rather than suggesting that either segment is already won.
Interpretation: Scores and weights are decision assumptions. Interviews, use-case tests and partner capacity should determine launch priorities.
Source: Supplied consulting report, Figure 5; financial workbook, Segmentation sheet; cited DOSM sector context and consultant scoring.
Refresh the compliance-led demand thesis before launch
The report treats Malaysian incorporation, tax, e-invoicing, privacy, employment and hosting as diligence workstreams. It proposes a local entity and partner, a MyInvois-capable product, statutory payroll, a data-protection owner and in-country hosting. Several legal and tax points in its source register are explicitly marked for verification; the article treats them as questions for Malaysian counsel and the relevant authorities, not settled advice.
A material date correction affects the demand case. Although the supplied October 2026 report says businesses below RM1 million turnover are exempt from e-invoicing, HASiL's official implementation timeline, updated 30 August 2026, says the exemption is below RM3 million. Core SME prospects in the RM1–3 million band cannot be counted on as mandate-driven buyers under the report's stated rationale. Re-segment the affected customer base, revisit the funnel's ERP-readiness and replacement rates, and rerun the model before citing compliance as a reliable sales catalyst.
The mid-market ideal-customer range begins at RM15 million revenue, so this particular exemption change does not remove the mandate from that segment. It still changes the lower-tier demand mix and reinforces the broader positioning: customers must buy useful finance, stock and manufacturing workflows, not merely a compliance deadline. Product certification, hosting, privacy and tax treatment remain go/no-go diligence items for the actual structure and release date.
Compare three structures before treating the conditioned variant as investable
Direct entry gives the vendor customer control and subscription margin but front-loads its own sales and delivery costs without a Malaysian reference base. Distributor-led entry lowers the fixed-cost burden while handing more margin and customer ownership to dealers, many of whom already sell incumbents. The local partnership model keeps a lean company presence, an anchor systems integrator and a certified network supported by company pre-sales.
On the workbook's initial assumptions, direct entry has negative RM2.62 million base NPV, partnership negative RM0.52 million and distributor-led entry negative RM3.88 million. Partnership is the least negative and scores 4.02 out of 5 on a strategic scorecard, compared with 2.20 for direct and 2.93 for distributor-led. Those scores mix model-derived value and funding measures with subjective criteria; B+ is an improved variant of partnership and was not separately scored.
The conditioned B+ case raises partner productivity, price realisation and reuse while capping operating costs. It improves the modelled base NPV to RM5.70 million and reduces peak cash at risk to RM6.84 million. The financial comparison is only as reliable as the client's real margins, partner economics and sales conversion. With no signed partner or quoted customer contracts, the value gap supports a staged test rather than immediate approval of the full envelope.
Swipe horizontally to view all columns.
| Measure | Direct A | Partner B | Distributor C | Partner B+ |
|---|---|---|---|---|
| Year-3 net ARR · RM m | 6.24 | 4.96 | 2.88 | 6.25 |
| Peak cash at risk · RM m | 15.81 | 11.31 | 8.90 | 6.84 |
| First three years' NPV · RM m | −11.28 | −8.62 | −6.76 | −6.01 |
| Full model base NPV · RM m | −2.62 | −0.52 | −3.88 | 5.70 |
| Strategic score / 5 | 2.20 | 4.02 | 2.93 | Not scored |
All figures are modelled. Peak cash includes the Year 4–6 fade; full NPV also includes a terminal value. B+ assumes all four conditions are secured.
Source: Original report pp. 14–16; board recommendation p. 1; financial workbook, Strategy_Compare and Model_A/B/C/B_Plus sheets.
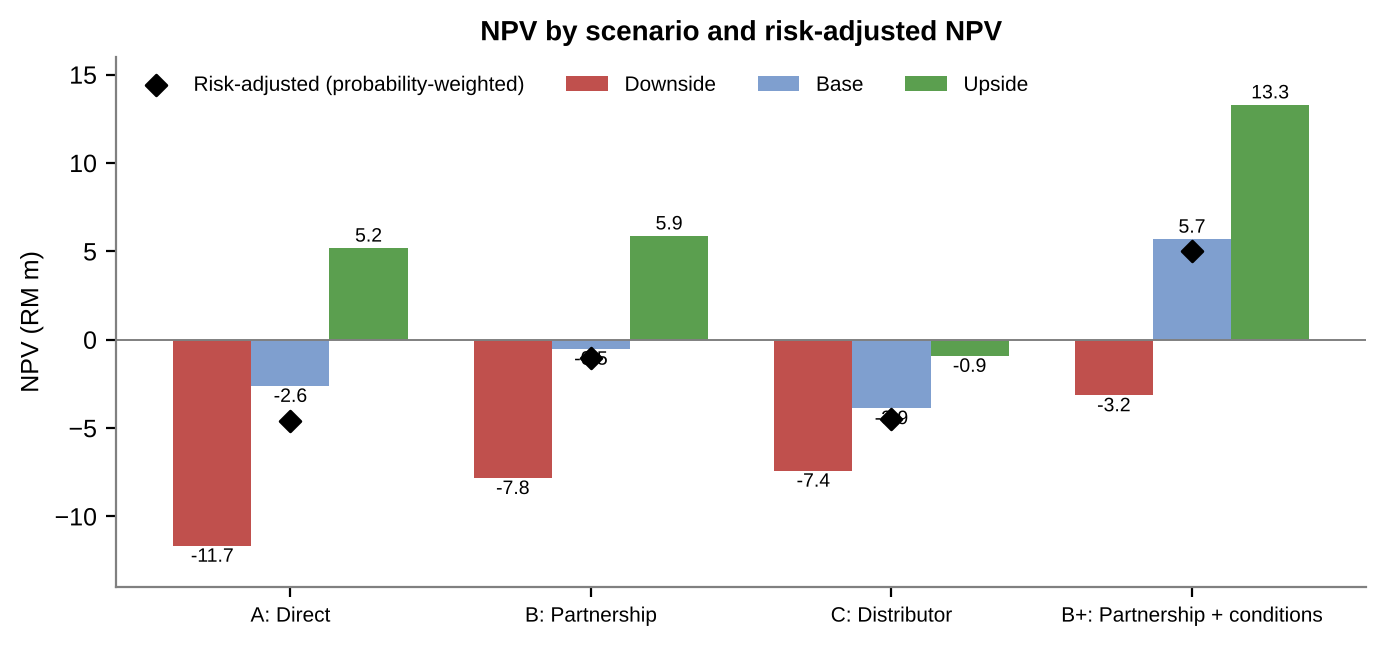
Figure 5. Only the conditional partnership clears the modelled base-case hurdle
Option B+ is the partnership model after four conditions precedent. Its positive RM5.70m base NPV and RM5.01m probability-weighted NPV rely on modelled outcomes beyond Year 3; every option has negative explicit three-year NPV.
Interpretation: These are prospective scenario values for an illustrative client. The partner terms, revenue ramp and post-Year-3 fade require evidence before capital approval.
Source: Supplied consulting report, Figure 6; financial workbook, Strategy_Compare and Model_B_Plus sheets.
Make the four sources of value contractual and observable
The source bridges partnership B's negative RM0.52 million base NPV to B+'s positive RM5.70 million by four changes. Reusing a product-localisation layer cuts India engineering effort by 30%. Anchor-partner co-selling and certification lift deals per active partner by 20%. Value-based packaging raises price realisation by 5%, while a gate-level cost cap reduces operating cost by 10%. The combined RM6.22 million uplift includes a small model interaction; adding the four isolated sensitivities alone gives RM6.16 million.
Partner productivity contributes the largest isolated uplift, RM3.06 million, and is also the least controllable. The model should therefore be conditioned on an anchor agreement with named co-selling duties, implementation quality, data access and reference rights. Gate 2 tests the thesis through at least three partners with two or more closed deals. A signed partner count without active selling would not substantiate the value uplift.
Product reuse and cost discipline can be engineered and budgeted, but their expected savings need a work breakdown and accountable owners. Pricing should be tested against actual mid-market proposals and discounts, not applied mechanically to a spreadsheet. The B+ workbook applies all four benefits from Year 1, although partner productivity is proposed for proof at Gate 2; a real plan must reconcile that timing. If one or more conditions fails, the correct comparator is the unmodified partnership's negative valuation—or a rebuilt plan—not the B+ headline.
Swipe horizontally to view all columns.
| Condition | Required change | Isolated uplift · RM m |
|---|---|---|
| Reusable localisation | India engineering effort −30% | 0.86 |
| Partner co-selling | Deals per active partner +20% | 3.06 |
| Price discipline | Realised price +5% | 0.78 |
| Operating-cost cap | Operating cost −10% | 1.46 |
| Combined B+ | All four, including interaction | 6.22 |
These are model sensitivities and proposed conditions, not secured savings or observed sales gains.
Source: Original report pp. 5 and 21; board recommendation p. 2; financial workbook, Sensitivity and Model_B_Plus sheets.
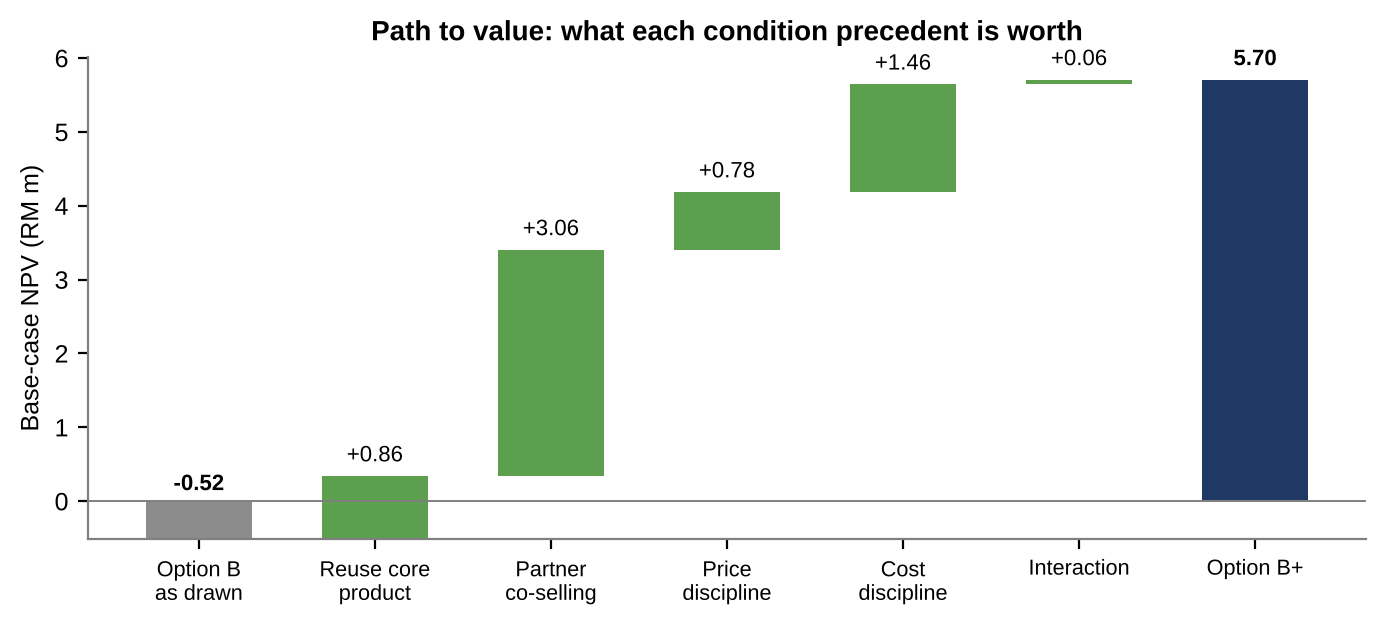
Figure 6. Partner co-selling contributes the largest modelled uplift
The four conditions convert a near break-even partnership into a positive modelled case. Co-selling accounts for nearly half of the RM6.22m uplift and depends on actual partner behaviour.
Interpretation: This is a scenario bridge, not realised value. Each condition must be secured and tested at the proposed gates.
Source: Supplied consulting report, Figure 12; financial workbook, Sensitivity section E and Model_B_Plus sheet.
Read the cash trough and terminal dependency together
The B+ operating model builds new logos from active partners and deals per partner, then applies customer mix, churn and contract values. Revenue includes net subscription fees, implementation and partner enablement. It rises from RM0.67 million in Year 1 to RM5.49 million in Year 3, with 349 closing customers and RM6.25 million closing net ARR. The Year-3 revenue and ARR numbers differ because revenue is earned across the year while ARR is an end-period run rate.
Spending on localisation, the Malaysia team, marketing and support keeps EBITDA negative through Year 3. Free cash flow is negative in every explicit year, after the RM1.59 million pre-launch outflow, and cumulative cash reaches negative RM6.84 million at the end of Year 3. The model does not show realised customer revenue or cash receipts; its working-capital assumptions include 60-day receivables and deferred revenue that should be tested against proposed contract terms.
At a 12% discount rate, the set-up and first three years' cash flows contribute negative RM6.01 million to NPV. Years 4–6 add RM2.07 million of discounted cash flow and a haircutted Year-6 terminal value adds RM9.64 million, yielding RM5.70 million. Cumulative operating cash remains negative RM2.93 million even at the end of Year 6; the terminal value is not cash payback. The so-called no-fade sensitivity is RM1.24 million, but it still includes a terminal value. The case therefore depends on reaching a credible Year-3 ARR base and sustaining value beyond the explicit operating plan.
Swipe horizontally to view all columns.
| Measure | Set-up · Y0 | Y1 | Y2 | Y3 |
|---|---|---|---|---|
| Revenue | 0.00 | 0.67 | 2.45 | 5.49 |
| EBITDA | −1.59 | −2.78 | −2.19 | −0.61 |
| Free cash flow | −1.59 | −2.76 | −2.10 | −0.39 |
| Cumulative free cash flow | −1.59 | −4.35 | −6.45 | −6.84 |
| Closing customers | 0 | 56 | 174 | 349 |
Rounded source-model projections. The Year-0 set-up cost is shown in EBITDA by the supplied model and should be reconciled to a real accounting plan.
Source: Original report p. 18; financial workbook, Model_B_Plus Base block.
Swipe horizontally to view all columns.
| Component | Present value | Interpretation |
|---|---|---|
| Set-up and Years 1–3 | −6.01 | Explicit decision-period free cash flow |
| Years 4–6 fade cash flow | +2.07 | Assumed growth and margin convergence |
| Year-6 terminal value | +9.64 | Includes a 20% valuation haircut |
| Full-model NPV | +5.70 | At the assumed 12% discount rate |
Rounded components sum to the source result. The terminal-value contribution is larger than the total NPV, so later performance is decisive.
Source: Original report pp. 19–20; financial workbook, Model_B_Plus and Strategy_Compare sheets.
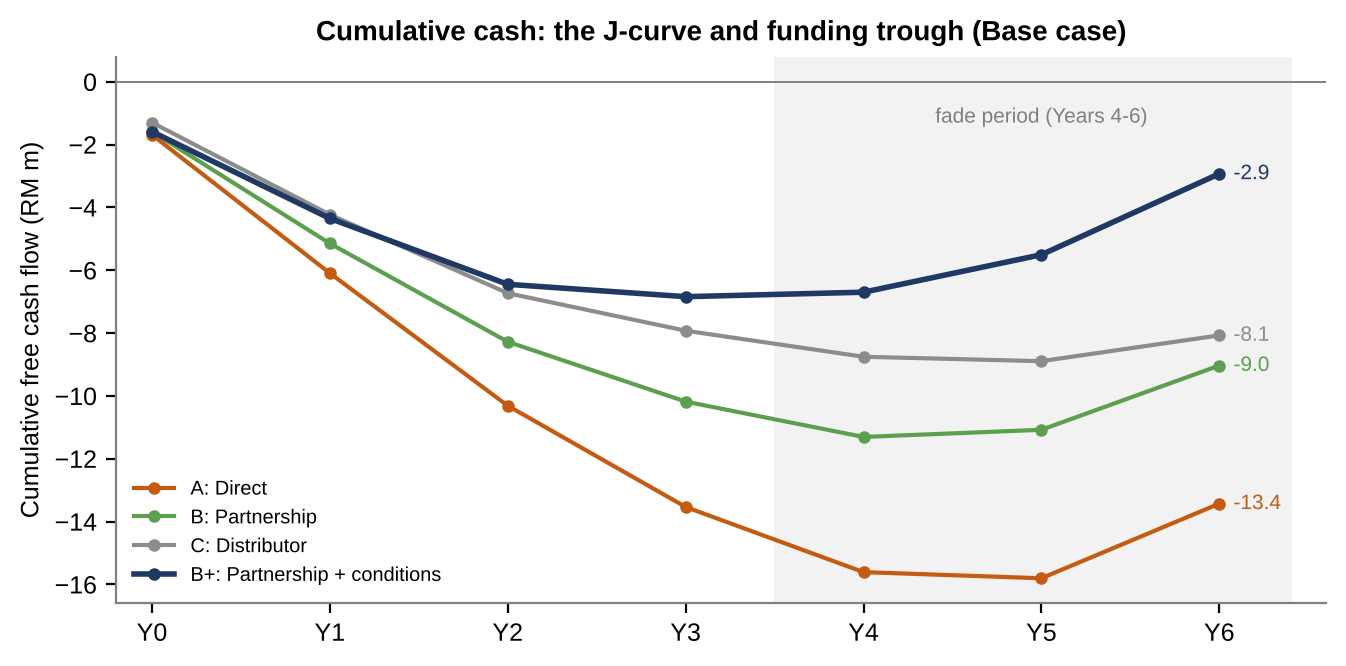
Figure 7. The conditional plan still has a funding trough
The chart separates the funding requirement from NPV. Option B+ has the smallest modelled peak cash exposure, but its cumulative operating cash remains negative through the displayed Year-6 fade period.
Interpretation: Cumulative free cash flow excludes terminal value; a positive NPV does not establish cash payback within the years plotted.
Source: Supplied consulting report, Figure 10; financial workbook, Model_A, Model_B, Model_C and Model_B_Plus sheets.
Stress the partner plan, rather than treating the base as a forecast
The downside scenario cuts new-logo volume to 65% of plan, sets price at 90% of plan, adds three points of churn and raises operating costs by 5%. It produces negative RM3.15 million full-model NPV and RM11.69 million worst-case cash at risk. The upside produces RM13.30 million NPV. Scenario probabilities in the workbook are management judgements, not frequencies estimated from historical Malaysian ERP entries; the resulting RM5.01 million risk-adjusted NPV is therefore a decision aid rather than a statistical expected return.
A one-driver sensitivity shows B+ NPV moving from about RM0.9 million at 75% of planned new-logo volume to RM10.4 million at 125%. Varying the discount rate across the source's test points moves NPV from about RM2.1 million to RM10.0 million. The model's 70% volume break-even is a valuation threshold that includes later value, not a claim that Year-3 EBITDA or cumulative cash breaks even at 70% of plan.
The 26-risk register gives three Critical and ten High inherent risks, led by incumbent lock-in, lack of local trust and reliance on post-Year-3 value. Its residual scores fall after assumed mitigations; they are proposed control targets, not evidence that the risk has already diminished. The investment committee should own a live dashboard for partner-sourced pipeline, qualified wins, churn, realised price, implementation quality and cash burn, and revise the forecast when those indicators diverge.
Swipe horizontally to view all columns.
| Measure | Downside | Base | Upside |
|---|---|---|---|
| New-logo volume vs plan | 65% | 100% | 130% |
| Price vs plan | 90% | 100% | 108% |
| Full-model NPV · RM m | −3.15 | 5.70 | 13.30 |
| Year-3 net ARR · RM m | 3.6 | 6.25 | 8.9 |
| Judgement probability | 25% | 55% | 20% |
The scenario matrix is illustrative. Its probability weights and stop-loss effectiveness must be re-estimated with real partner and customer data.
Source: Original report pp. 14 and 20–23; financial workbook, Model_B_Plus, Strategy_Compare, Sensitivity and Risk_Register sheets.
Release the next tranche only when the last assumption survives contact with the market
The proposed sequence starts with prospect and partner validation, then a limited foundation budget, product readiness, a commercial launch and annual continuation reviews. The source places the Phase-0 interviews both before and just after the initial Board gate in different documents. A real sponsor should resolve that sequence by granting a tightly bounded research authorization before approving the larger foundation and launch tranches.
Gate 0 proposes RM1.59 million, subject to confirmation of the client profile, 25 customer and 10 partner interviews, and an anchor-partner term sheet. Gate 1 releases RM2.76 million only after the proposed MyInvois-ready product, at least four signed partners and at least five design customers. At Gate 2, the case asks for at least RM0.61 million closing net ARR, 39 customers, churn no more than 12% and three productive partners; failure would trigger a stop-or-resize decision at roughly RM4.35 million cumulative base exposure.
Gate 3 requires at least RM2.04 million ARR, nine active partners and a partner-sourced pipeline before further depth investment. Gate 4 is stricter than the earlier 70% continuation gates: it requires the full RM6.25 million Year-3 ARR target and a credible path to EBITDA break-even within 12 months. The RM12 million maximum risk appetite is a placeholder from the fictional client profile, and the source's stage-gate option value assumes management actually stops when the evidence fails.
Swipe horizontally to view all columns.
| Gate | Model timing | Release · RM m | Proof required |
|---|---|---|---|
| 0 · Foundation | Q4 2026 | 1.59 | Validate key assumptions; agree anchor-partner terms |
| 1 · Launch readiness | Q2 2027 | 2.76 | Localisation and compliance ready; 4 partners; 5 design customers |
| 2 · Year-1 review | Q1 2028 | 2.10 | ARR ≥ RM0.61m; 39 customers; churn ≤ 12%; 3 productive partners |
| 3 · Year-2 review | Q1 2029 | 0.39 | ARR ≥ RM2.04m; 9 active partners; CAC payback ≤ 24 months |
| 4 · Year-3 decision | Q1 2030 | Scale / hold / exit | ARR ≥ RM6.25m and EBITDA break-even within 12 months |
Release amounts add to the modelled RM6.84m base cash requirement. Dates and gates are proposals, not observed milestones.
Source: Original report pp. 24–26; board recommendation p. 2; financial workbook, Roadmap and Model_B_Plus sheets.
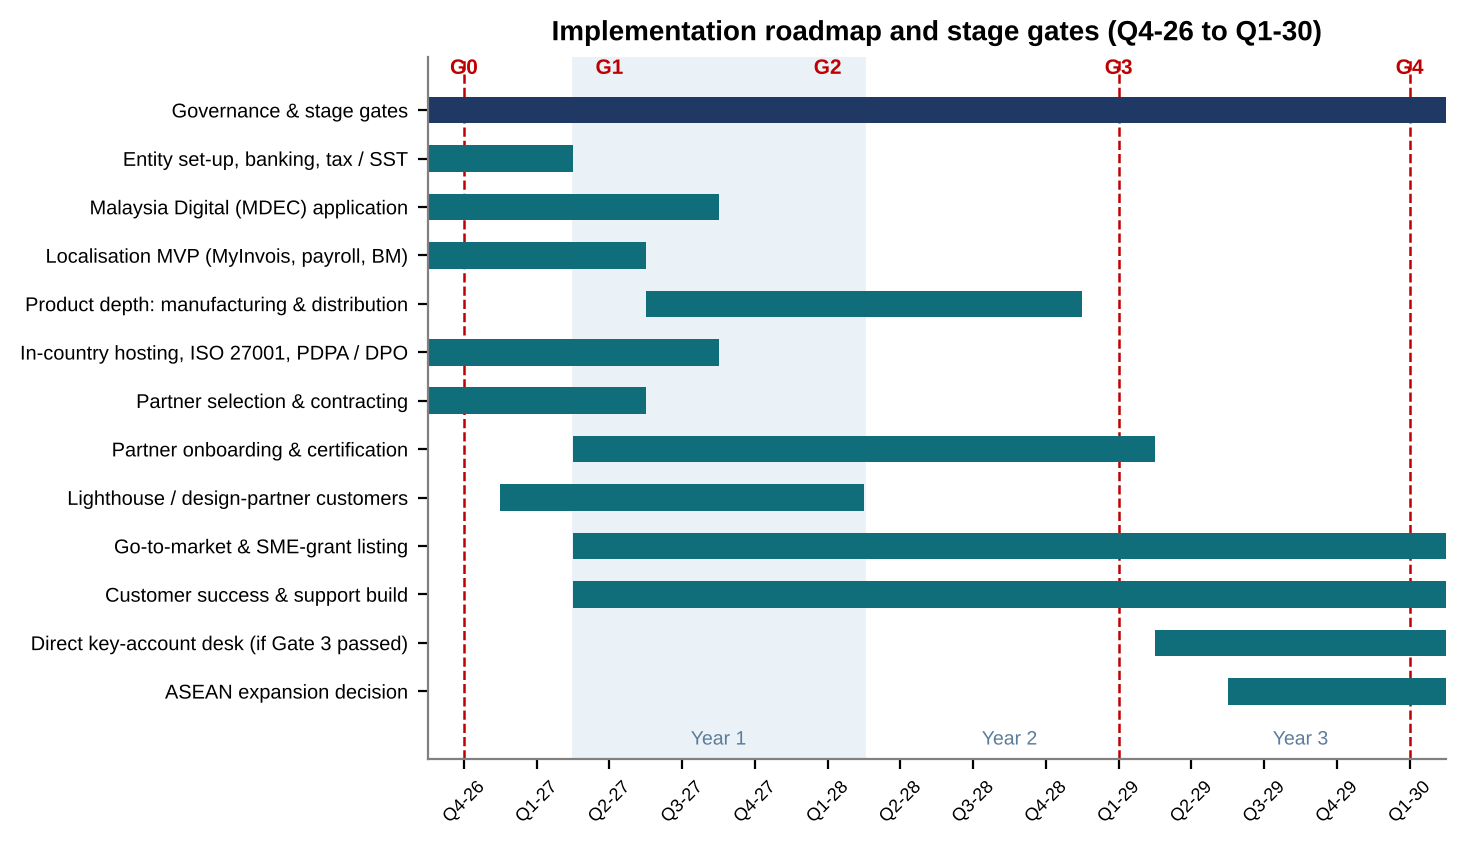
Figure 8. The roadmap sequences localisation, partners and customer proof
The proposed sequence moves from approval and launch readiness to Year-1 and Year-2 commercial reviews, then a Year-3 hold-or-expand decision. Partner capability and reference customers are gating inputs, not parallel promises.
Interpretation: All dates and workstreams are plans in an illustrative case, not evidence of execution.
Source: Supplied consulting report, Figure 14; financial workbook, Roadmap sheet.
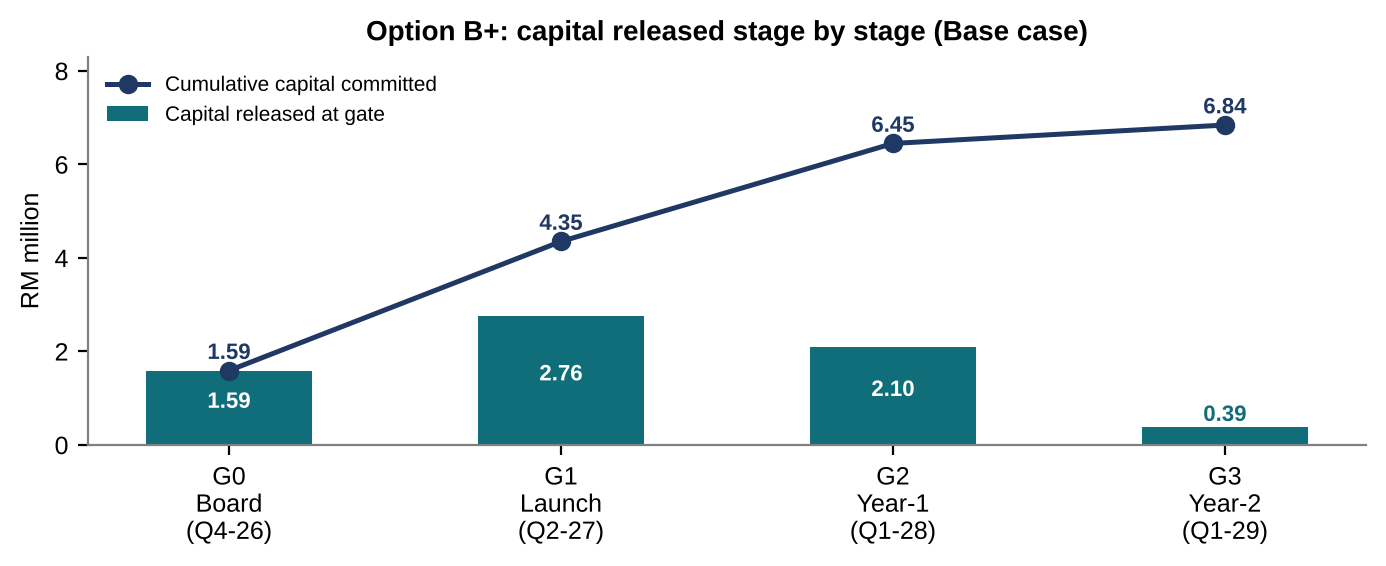
Figure 9. Proposed gates stage the RM6.84m base funding envelope
The first hard commercial review follows the G0 and G1 releases. Later tranches depend on launch readiness, active partners, customer ARR and churn thresholds in the source plan.
Interpretation: A staged budget only limits downside if the Board enforces the stop or resize decisions; the figures are proposed releases, not actual spend.
Source: Supplied consulting report, Figure 15; financial workbook, Roadmap and Model_B_Plus sheets.
What the package proves, and what a real entry would still need
The package demonstrates a coherent decision method: start from an identifiable business base, narrow to plausible buyers, compare structures, expose the value of four conditions and make capital release conditional on operating evidence. Its 16-sheet workbook and original chart set let readers inspect assumptions and scenario mechanics rather than accept a single headline NPV.
It does not establish customer demand, partner productivity, regulatory clearance, implementation economics or a real investment return. The supplied report itself marks major funnel percentages, contract prices, productivity, churn, discount rate, scenario probabilities and post-Year-3 valuation as judgements. Its e-invoicing exemption statement also conflicts with the official August 2026 update, which is why this article identifies the correction instead of repeating the source unchecked.
A live decision would require actual client financials, a current legal and tax review, customer and partner research, competitive quotes, pilot conversion data, product certification evidence and a rebuilt downside cash plan. The downloadable originals remain unchanged so readers can see both the analytical work and its limitations.
Supporting evidence
Additional charts and frameworks from the source study.
Figure 10. Price access alone does not close the localisation gap
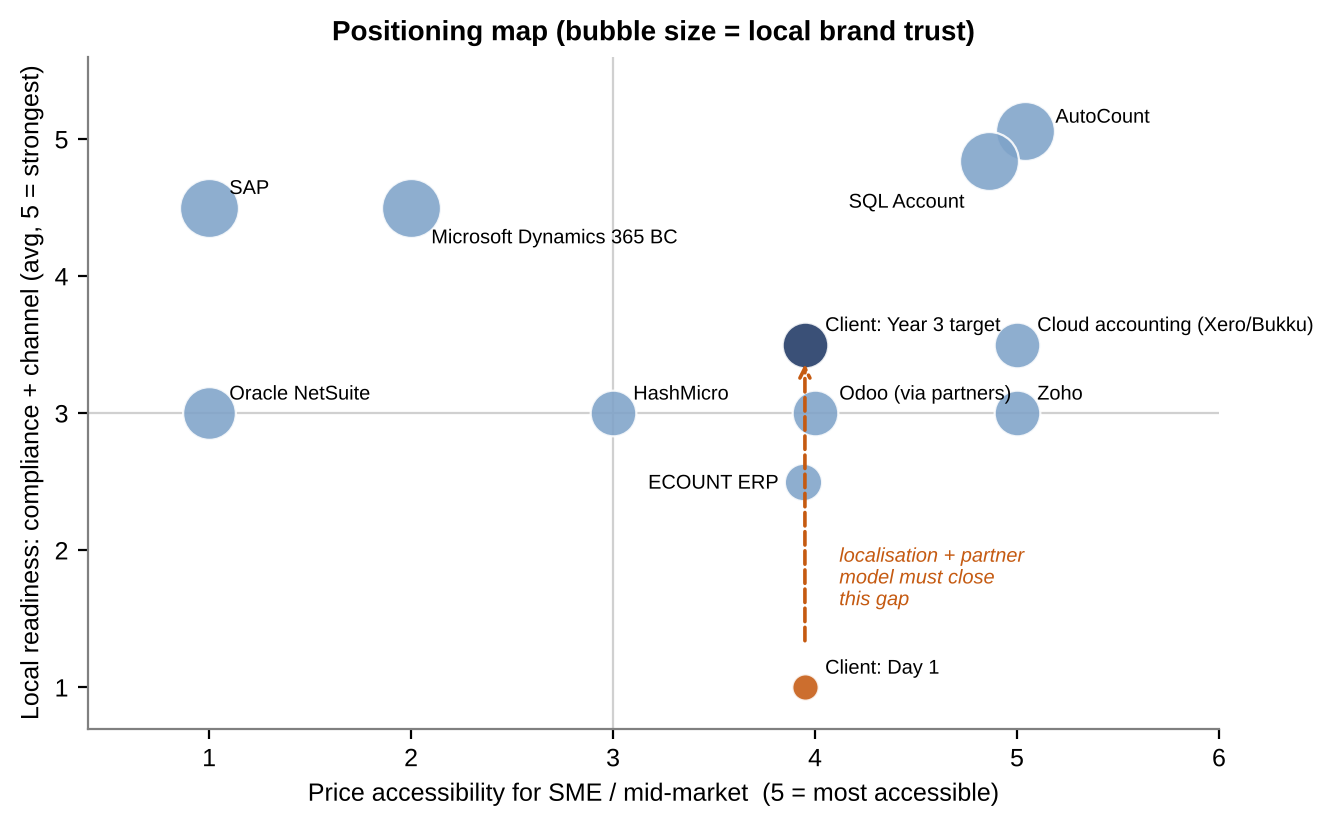
Figure 10. Price access alone does not close the localisation gap
Bubble size represents the consultant's brand-trust score. The map visualises a proposed change in position, rather than a measured shift in buyer perception.
Interpretation: Both axes and bubble sizes are judgement scores based on public positioning; validate with customer and partner research.
Source: Supplied consulting report, Figure 4; financial workbook, Competitors sheet.
Figure 11. All four options remain EBITDA-negative in Year 3
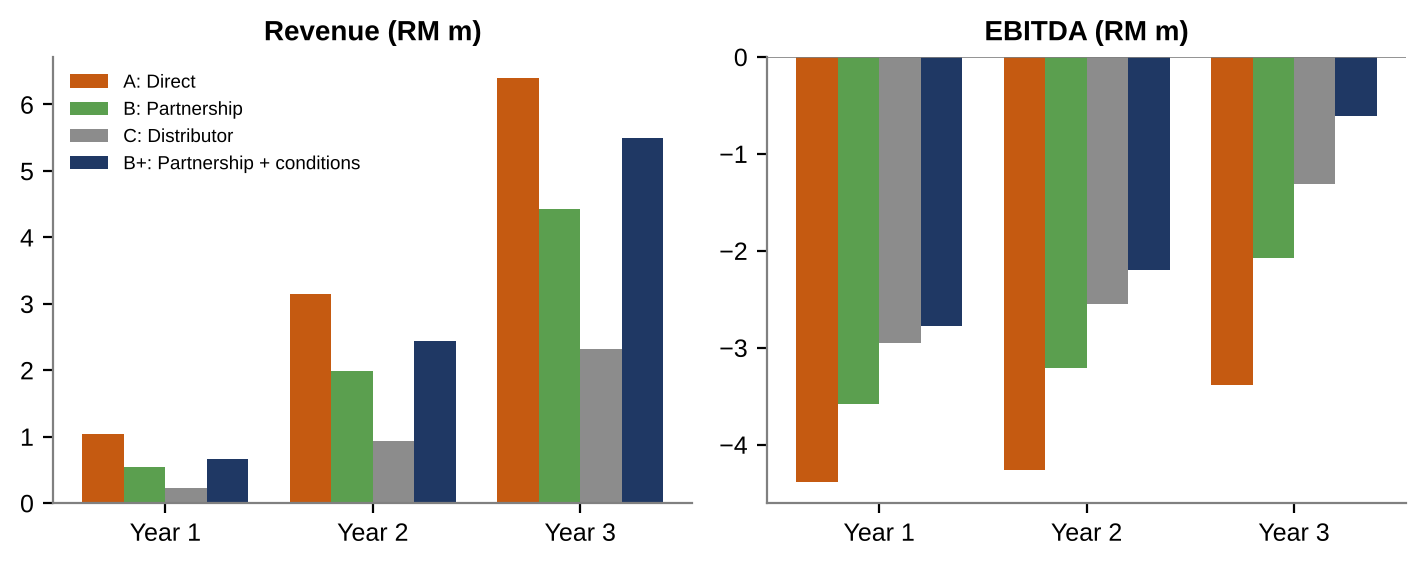
Figure 11. All four options remain EBITDA-negative in Year 3
The comparison makes the horizon dependency visible: the positive B+ base NPV is not supported by operating break-even within the first three years.
Interpretation: All values are projections. Revenue is not closing net ARR, which is tracked separately in the workbook.
Source: Supplied consulting report, Figure 8; financial workbook, Model_A, Model_B, Model_C and Model_B_Plus sheets.
Figure 12. Logo volume and the discount rate drive the widest NPV swings
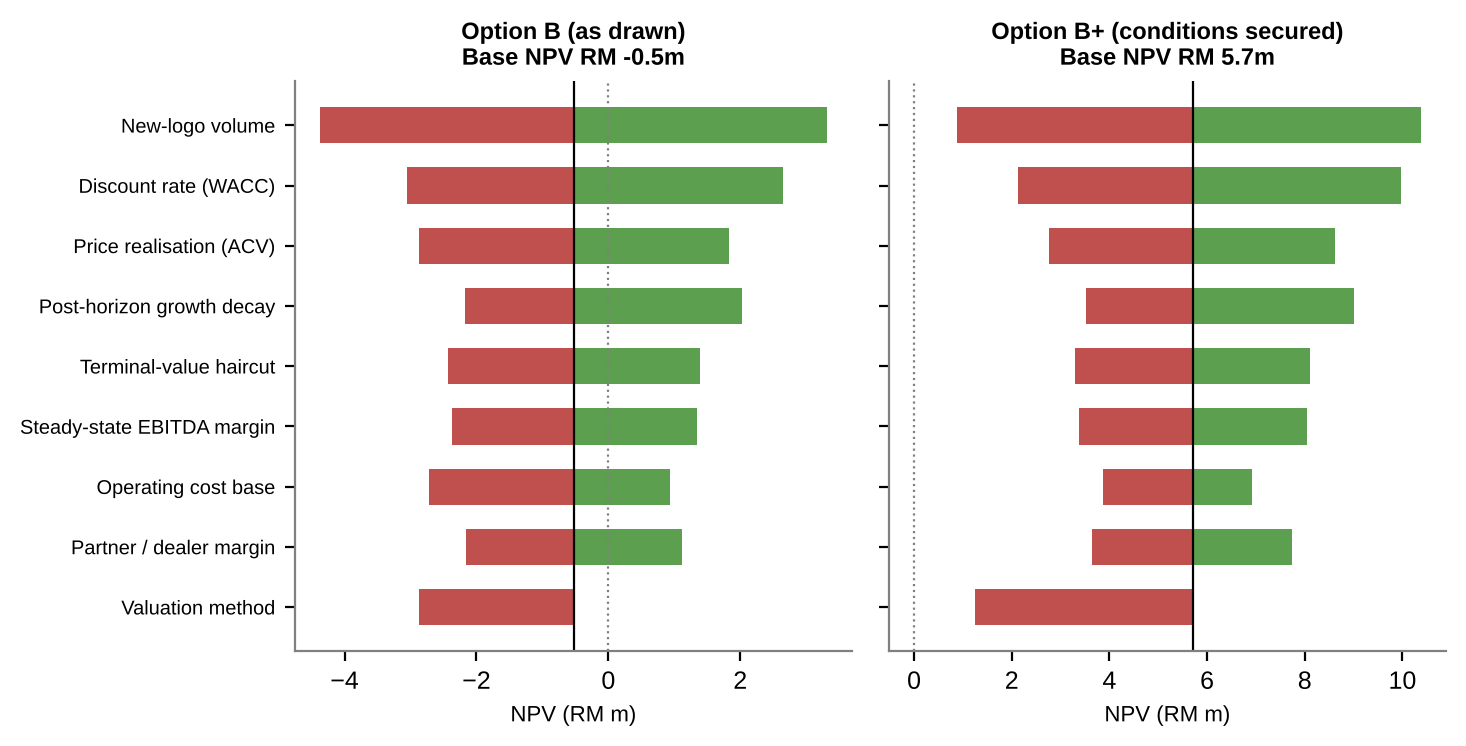
Figure 12. Logo volume and the discount rate drive the widest NPV swings
The one-variable shocks highlight volume and financing assumptions as major sources of uncertainty; they do not substitute for a combined downside scenario.
Interpretation: The original tornado outputs are static snapshots and must be rerun if underlying assumptions change.
Source: Supplied consulting report, Figure 11; financial workbook, Sensitivity sheet, based on model reruns.
Figure 13. The risk register assumes material mitigation before launch

Figure 13. The risk register assumes material mitigation before launch
The residual map is the case team's assessment after proposed controls, including partner selection, localisation and commercial gates. It does not show observed risk reduction.
Interpretation: Residual scores depend on implementing the mitigations, and their effectiveness should be challenged during diligence.
Source: Supplied consulting report, Figure 13; financial workbook, Risk_Register sheet.
Figure 14. Partnership leads the weighted strategic scorecard
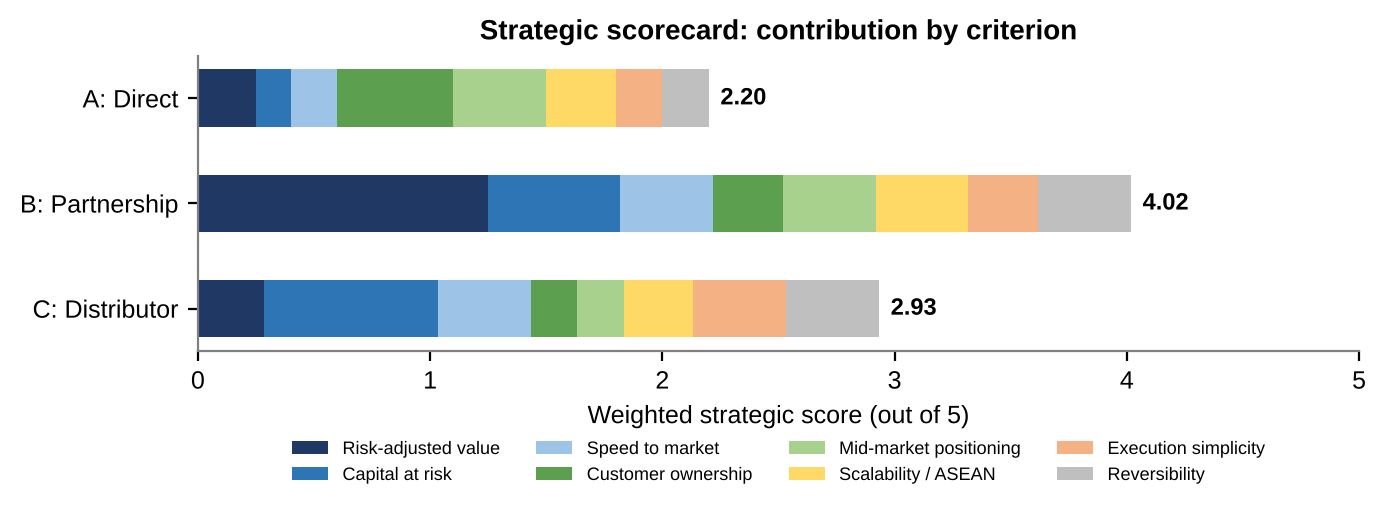
Figure 14. Partnership leads the weighted strategic scorecard
Risk-adjusted value and capital-at-risk scores use model outputs; the other criteria are editable consultant judgements. The scorecard complements, but does not validate, the financial case.
Interpretation: Weights and qualitative ratings can change the ranking and should be reviewed with the actual decision makers.
Source: Supplied consulting report, Figure 7; financial workbook, Strategy_Compare sheet.
Figure 15. The value case depends on 349 closing customers by Year 3
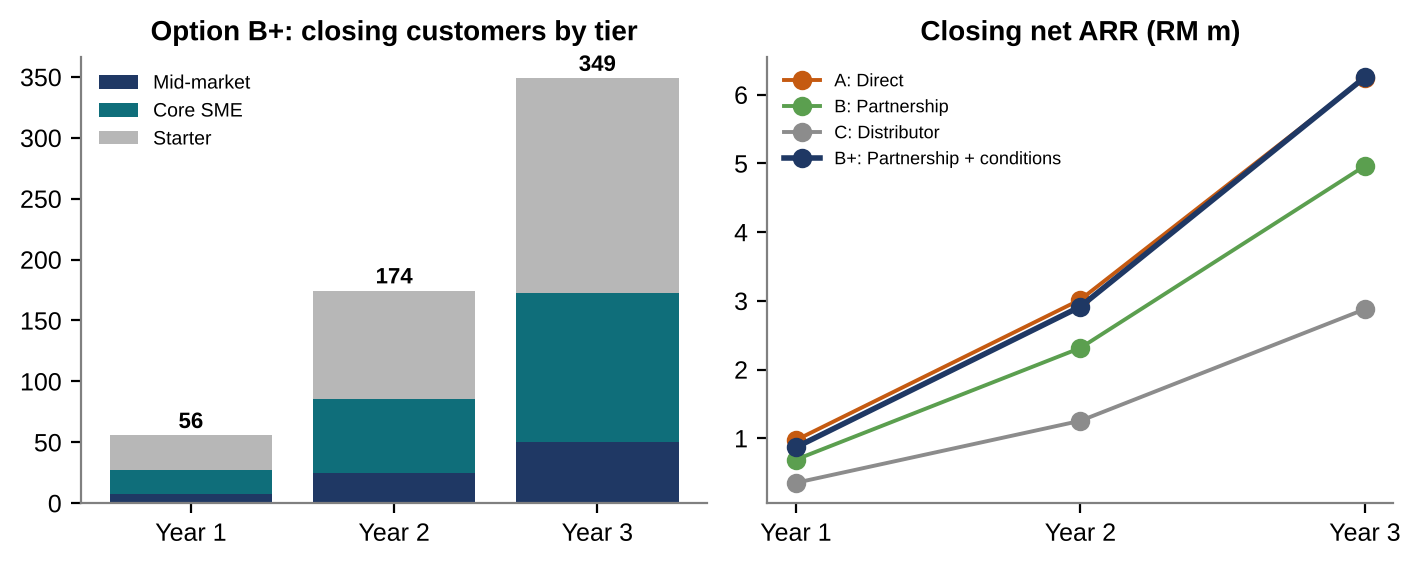
Figure 15. The value case depends on 349 closing customers by Year 3
The customer build combines starter, core SME and mid-market tiers. Partner productivity, retention and net ARR must be observed against the proposed commercial gates.
Interpretation: These are modelled acquisition and retention trajectories, not signed customer contracts or realised recurring revenue.
Source: Supplied consulting report, Figure 9; financial workbook, Model_B_Plus and other Model sheets.
Strategic priorities
Refresh the addressable demand and buyer trigger
Update the workbook for HASiL's RM3m e-invoicing exemption, separate compliance-led Core SME prospects from mid-market operational buyers, and validate funnel conversion with 25 customer and 10 partner interviews before using the RM57.4m contestable estimate in an investment decision.
Secure a productive anchor partnership
Contract for named co-selling actions, partner enablement, implementation quality, reference rights and shared pipeline data. Test the model's 20% productivity uplift through closed deals per active partner, not signed-partner totals.
Rebuild the financial case with real client inputs
Replace the fictional RM12m risk appetite and assumed contract values, engineering hours, partner margin, churn and cost base. Show explicit-period cash, fade-period cash and terminal value separately, with a funded downside and a credible stop cost; account for the fact that modelled cash remains negative through Year 6.
Use annual gates as decisions, not calendar milestones
Give the country lead and CFO clear evidence owners. At each gate, compare ARR, active partner output, realised price, retention, compliance and burn with the threshold; hold, resize or exit when evidence fails.
Path to implementation
Proposed sequencing and decision gates.
Validation · proposed Q4 2026
Test the commercial and regulatory premises
Interview target firms and integrators, refresh the e-invoicing segmentation, secure an anchor term sheet, obtain current legal/tax advice and substitute actual client inputs in the workbook.
Decision gate: A bounded foundation authorization only after key assumptions and partner terms are credible; resolve the source package's Phase-0/Gate-0 sequencing ambiguity.
Foundation · proposed Q4 2026–Q2 2027
Build the local operating and product base
Set up the proposed local entity and governance, develop and test MyInvois and payroll localisation against current official specifications, appoint the data-protection owner, recruit the first trained partners and secure design customers.
Decision gate: Launch only when product requirements are confirmed, at least four partners are signed and five design customers are committed.
Launch and prove · proposed Q2 2027–Q1 2028
Measure partner conversion and customer retention
Focus sales on distribution and manufacturing, support partner-led delivery, record pricing and win-loss evidence, and review cash monthly rather than waiting for an annual close.
Decision gate: Year-1 closing ARR at least RM0.61m, 39 customers, churn at most 12% and three partners with two or more closed deals; otherwise stop or resize.
Selective scale · proposed 2028–2029
Add vertical depth only after partner economics work
Grow toward nine active partners and test whether customer acquisition payback, implementation capacity and margin support a direct key-account desk or further product investment.
Decision gate: Year-2 closing ARR at least RM2.04m, nine active partners, partner-sourced pipeline at least 70% and CAC payback within 24 months.
Decision · proposed Q1 2030
Choose scale, hold or exit
Compare the realised customer base and cash position with the assumptions supporting the Year 4–6 fade and terminal value before any wider ASEAN commitment.
Decision gate: Require the full RM6.25m Year-3 ARR target and EBITDA break-even within 12 months; recalculate valuation and funding before releasing a new envelope.
Value and measurement
The completed output is an illustrative market-entry decision package: a 29-page report, two-page Board recommendation, 16-sheet live-formula workbook, 15 original charts, a 26-risk register and a five-gate roadmap. It recommends a conditional, partner-led entry and identifies what must be true for the modelled RM5.70m base NPV. No Malaysian launch, client contract, investment, customer acquisition, software certification or realised financial result is claimed.
Explore the evidence
Datasets & further reading
Download the source material to explore the analysis, inspect model assumptions, and read the full study.
Complete Malaysia market-entry study
Original package containing both PDFs, the formula workbook, source README and all 15 supporting charts.
ZIP · 2.6 MB
- Download PDF, 1.5 MB
Market-entry consulting report
Original 29-page assessment covering the full market, competition, financial, risk and roadmap analysis.
Report · PDF · 1.5 MB
- Download PDF, 67 KB
Executive investment recommendation
Original two-page conditional-go board paper, including conditions, option comparison and stage gates.
Report · PDF · 67 KB
- Download XLSX, 169 KB
Three-year financial model and datasets
Original 16-sheet Excel workbook with market-sizing data, segment and competitor scores, live option/scenario formulas, sensitivities, risks and roadmap.
Model · XLSX · 169 KB
- Download TXT, 3 KB
Source notes and workbook guide
Original README identifying supplied files, assumptions, items to verify and sensitivity-table staleness checks.
Supporting document · TXT · 3 KB
Sources and scope
The client and its RM12m capital limit are illustrative. Demand filters, geographic reach, annual replacement rate, contract values, sales productivity, churn, scenario weights, cost reductions and valuation fade are judgements; source residual-risk ratings assume mitigations succeed. The supplied October 2026 report's below-RM1m e-invoicing exemption is outdated against HASiL's 30 August 2026 below-RM3m threshold, so demand and compliance claims need revalidation. Positive base NPV relies on Year 4–6 cash and terminal value; the first three years alone have negative NPV, and cumulative cash remains negative at Year 6. Legal, tax and regulatory statements require current professional review. Original files are preserved without alteration.
Malaysia Market-Entry Feasibility Assessment · original report
29 pages, 14 October 2026. Market, competition, segmentation, regulation, option comparison, financial feasibility, 26-risk review, roadmap and methodological limits; all 15 original charts are reproduced in this article.
Executive Investment Recommendation · original board paper
Two pages, 14 October 2026. Conditional Option B+ recommendation, four conditions precedent, investment gates and stop conditions. The stated Board setting is part of an illustrative simulation.
Three-Year Financial Model · original workbook
Sixteen sheets with market and competitor inputs, four entry-mode models, three scenarios, valuation sensitivities, risk register, roadmap and source register. Prices, funnel rates and probabilities are assumptions.
Source README · original package
Defines the illustrative client and identifies judgement inputs, items requiring legal verification, the terminal-value dependency and static sensitivity snapshots.
- DOSM · Economic Census 2023 profile of SMEs (opens in a new tab)
Official statistical context for the Malaysian establishment base. Its Economic Census 2023 profile uses reference year 2022; the source study separately cites the 2023 MSME count.
- HASiL · official e-Invoice implementation timeline (opens in a new tab)
Updated 30 August 2026. States an exemption for taxpayers below RM3m annual turnover or revenue; this corrects the RM1m statement in the supplied report and must inform any refreshed demand model.
- SME Corp Malaysia · MSME profile and importance (opens in a new tab)
Original package's institutional context for the 2023 MSME count and size mix; distinguish observed base counts from the workbook's 2026 projected firm count.
Continue reading
Related case studies
Market entry / Financial modelling / Commercial strategy
Saffron Route Foods: a staged route into Malaysia
An evidence-led market-entry case connecting consumer segmentation, distributor economics and a five-year financial model to explicit investment gates.
Market entry / Investment strategy / Risk management
Build CtrlS’s Malaysia entry around contracted demand
A market-entry strategy that connects customer selection, infrastructure readiness and staged capital commitments for a proposed Cyberjaya facility.
Retail operations / Profitability analytics / Inventory optimisation
Retail Operations Transformation & Profitability Optimisation
An end-to-end retail profitability diagnosis connecting store economics, assortment, inventory and a staged investment case across a simulated 20-store chain.