Retail operations / Profitability analytics / Inventory optimisation
Retail Operations Transformation & Profitability Optimisation
An end-to-end retail profitability diagnosis connecting store economics, assortment, inventory and a staged investment case across a simulated 20-store chain.
The recommendation
Growing sales is not enough when discounting and stock allocation weaken the economics of every sale.
FY26 revenue rises 7.6% to ₹50.00 crore, while operating profit falls 9.0% to ₹8.50 crore and margin contracts from 20.1% to 17.0%. Six stores need different recovery plans, while inventory allocation and discount governance need chain-wide attention. The proposed seven-initiative programme produces ₹1.11 crore of annual net benefit in the base model, with ₹0.80 crore of upfront cost, ₹1.09 crore of three-year NPV at 12%, and a 17-month ramped payback. Conservative delivery is only slightly positive over three years; the stress case destroys value. Those results support a four-store pilot and funding released against evidence.
Decision at stake
Test inventory rebalancing and discount discipline, begin supplier and lease negotiations, and release the proposed programme budget in stages against service and financial gates.
A synthetic 20-store retailer grows sales while profit declines. The study uses 38,400 store–SKU–month records, 480 store operating records and a six-table analytical model to identify the sources of leakage and evaluate seven proposed interventions. The operating problems were deliberately engineered; this is a demonstration of consulting method, not a commissioned client engagement.
Evidence and decision parameters
- Revenue growth
- +7.6%
- Synthetic FY26 revenue reaches ₹50.00 crore; operating profit falls 9.0% over the same period.
- Operating-margin decline
- −3.1 pp
- Margin falls from 20.1% in FY25 to 17.0% in FY26, after the study's holding-cost and HQ allocations.
- Modelled annual net benefit
- ₹1.11 cr
- Base-case steady-state improvement after ₹0.19 crore of annual programme running costs; no implementation outcome is claimed.
- Modelled three-year NPV
- ₹1.09 cr
- At a 12% discount rate, excluding working-capital release; upfront programme cost is ₹0.80 crore.
A management problem translated into an auditable analytical model
The assignment asks five connected questions: which stores underperform, where operating cost is concentrated, which products generate sales without adequate contribution, how stock should be allocated, and which operational changes justify investment. Answering them together matters. A profitable category may still tie up too much cash; a weak store may have a lease problem rather than a demand problem; a stock reduction may improve carrying cost while damaging availability.
The supplied dataset covers April 2024 to March 2026, with FY25 and FY26 each containing twelve complete months. It contains 20 stores, 80 SKUs, eight categories, three store formats and five region labels. All six CSVs are available for download. The original report states four regions, but the store dimension also includes Central; the website follows the source table. The data were generated with fixed seed 2026 and calibrated to approximately ₹50 crore of FY26 sales. Rent-heavy malls, staffing mismatches, stock imbalance and discount creep are designed features of the simulation.
The method first aggregates store–SKU–year economics, then builds store P&Ls with an 18% annual inventory holding charge and HQ allocated by revenue share. Gross margin deducts COGS from net revenue. Product contribution also deducts freight, write-offs and holding cost. Fully loaded operating profit then deducts store operating expenses and allocated HQ. These definitions keep a product's direct economics distinct from the economics of the whole store.
Swipe horizontally to view all columns.
| Table | Grain | Records | Analytical purpose |
|---|---|---|---|
| Sales and inventory | Store × SKU × month | 38,400 | Sales, price realisation, COGS, freight, stock, stock-outs and write-offs |
| Store operations | Store × month | 480 | Rent, labour, hours, transactions, footfall and operating expenses |
| HQ costs | Fiscal year | 2 | Company overhead allocated by annual store revenue share |
| Store dimension | Store | 20 | Format, region and selling area |
| SKU dimension | SKU | 80 | Category, MRP, unit cost and unit freight |
| Date dimension | Month | 24 | Fiscal year, fiscal quarter and calendar days |
Every store–SKU combination has a complete 24-month history. All operating records are synthetic.
Source: Independent recomputation from the six supplied retail CSV tables using the definitions in the original report and SQL.
The first diagnosis: sales growth masks a weaker margin structure
Revenue rises from ₹46.48 crore to ₹50.00 crore, but COGS grows faster, from ₹28.84 crore to ₹32.23 crore. Gross-margin rupees barely move, while the gross-margin rate falls from 38.0% to 35.5%. After operating costs, profit falls by approximately ₹0.84 crore. The cost-to-revenue ratio therefore increases from 79.9% to 83.0%. Sales growth is real within the dataset, but it does not translate into healthier unit economics.
Discount creep explains the largest part of the rate deterioration. Repricing FY26 volumes at FY25 category discount rates lifts the counterfactual gross-margin rate by about 2.2 percentage points, approximately 70% of the 3.1-point operating-margin decline. This is a diagnostic counterfactual, not a forecast of recoverable profit: it holds units constant and recalculates both revenue and the margin denominator. The initiative model later allows for customer response to higher realised prices.
Inventory holding cost and write-offs together rise by approximately ₹0.26 crore. Holding cost grows 25.3% and write-offs 42.6%, well ahead of sales. Rent and staff cost remain broadly stable as shares of chain revenue, so blanket expense reductions would miss the dispersion across stores. The practical response is to address discount and stock processes across the chain while targeting structural store problems individually.
Swipe horizontally to view all columns.
| Measure | FY25 | FY26 | Interpretation |
|---|---|---|---|
| Net revenue | ₹46.48 cr | ₹50.00 cr | +7.6%; sales increase |
| COGS | ₹28.84 cr | ₹32.23 cr | +11.8%; cost grows faster than sales |
| Gross margin | ₹17.64 cr / 38.0% | ₹17.77 cr / 35.5% | Rate falls approximately 2.4 pp |
| Inventory holding cost | ₹0.64 cr | ₹0.80 cr | +25.3%; based on average closing inventory |
| Write-offs | ₹0.22 cr | ₹0.31 cr | +42.6%; especially important in Apparel |
| Rent / staff as share of revenue | 5.3% / 5.0% | 5.2% / 5.1% | Chain averages conceal store-level issues |
| Operating profit / margin | ₹9.34 cr / 20.1% | ₹8.50 cr / 17.0% | Profit −9.0%; margin −3.1 pp |
₹1 crore = ₹10 million. Operating profit includes the report's holding charge and revenue-based HQ allocation.
Source: Independent recomputation from the six supplied retail CSV tables using the definitions in the original report and SQL.
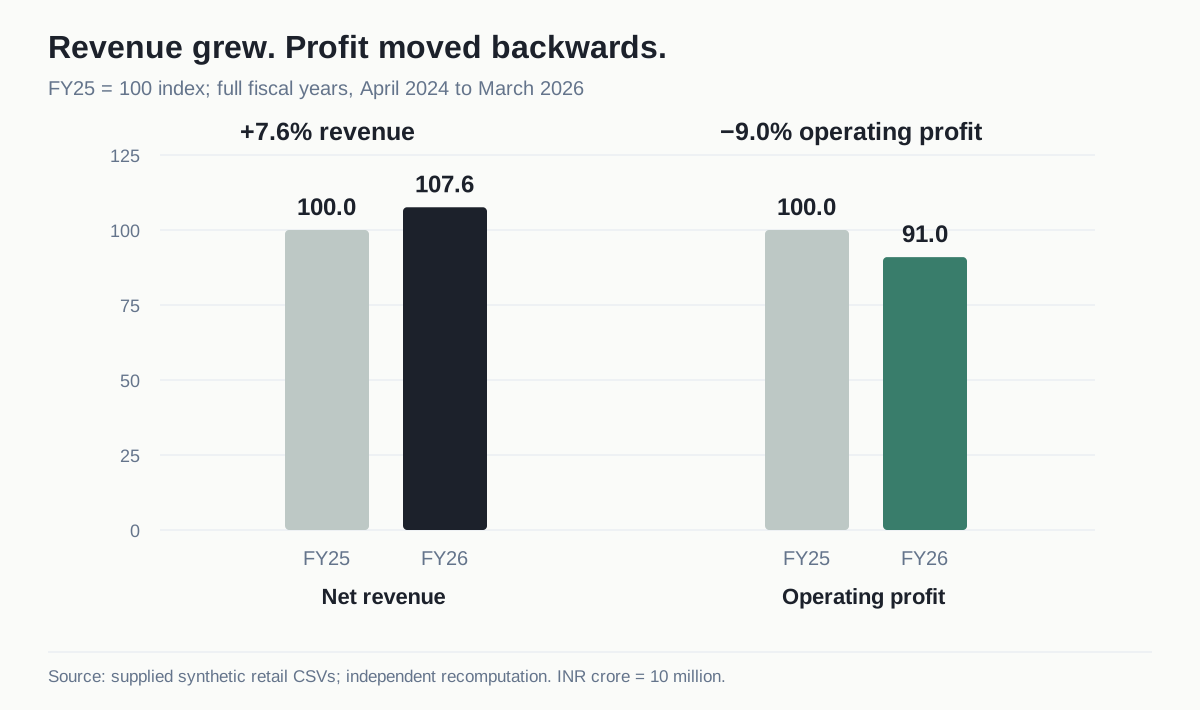
Figure 1. Revenue growth does not translate into profit growth
Using an index puts the two growth rates on a comparable basis. Revenue grows 7.6%, but operating profit falls 9.0% after the study's operating-cost definitions and allocations.
Source: Website analysis independently recomputed from the supplied synthetic retail CSVs, April 2024–March 2026. Definitions follow the original Retail Operations Transformation report.
Six underperforming stores, several different operating problems
Six stores earn less than 15% operating margin: Lucknow, Bhopal, Patna, Mumbai Lower Parel, Surat and Kolkata. Together they generate approximately 26% of revenue and 17% of profit. Their average margin is about 11.3%, compared with 19.0% for the other fourteen stores. Applying that peer rate to their sales implies approximately ₹1.00 crore of annual profit opportunity. This benchmark is a diagnostic gap, not an additional benefit to add to the seven-initiative business case.
The store economics separate into four overlapping patterns. Kolkata and Lower Parel carry rent of 11.2% and 10.8% of sales, versus 5.2% for the chain. Lucknow, Surat and Patna produce only ₹820–₹930 per labour hour, compared with a chain median near ₹1,587. Patna and Bhopal have elevated shrinkage and freight burdens. Surat and Bhopal also show the weakest price realisation. A single cost-cutting programme would treat these mechanisms too crudely.
Every store remains profitable after allocated HQ. The proposed response therefore preserves the network while improving leases, rosters, stock discipline and discount controls. Lease events provide a natural point to reconsider the rent-heavy locations if negotiations fail. Real decisions would also require lease commitments, closure costs, customer overlap and the portion of HQ that could actually be avoided.
Swipe horizontally to view all columns.
| Store | Margin | Revenue / labour hour | Rent / revenue | Primary proposed response |
|---|---|---|---|---|
| S08 · Lucknow | 14.3% | ₹930 | 4.5% | Footfall-led rostering and attrition-led capacity reset |
| S14 · Bhopal | 13.4% | ₹1,130 | 4.5% | Availability, shrinkage and discount exceptions |
| S11 · Patna | 12.0% | ₹820 | 3.7% | Labour productivity, stock counts and access discipline |
| S17 · Mumbai Lower Parel | 11.4% | ₹1,448 | 10.8% | Lease negotiation and sales-density review |
| S19 · Surat | 8.9% | ₹870 | 7.6% | Labour productivity and discount governance |
| S04 · Kolkata | 8.5% | ₹1,070 | 11.2% | Lease negotiation and store economics review |
FY26 baseline. Different constraints can overlap within the same store; the table identifies priorities, not exclusive causes.
Source: Independent recomputation from the six supplied retail CSV tables using the definitions in the original report and SQL. Report Table 3.1 and store archetypes.
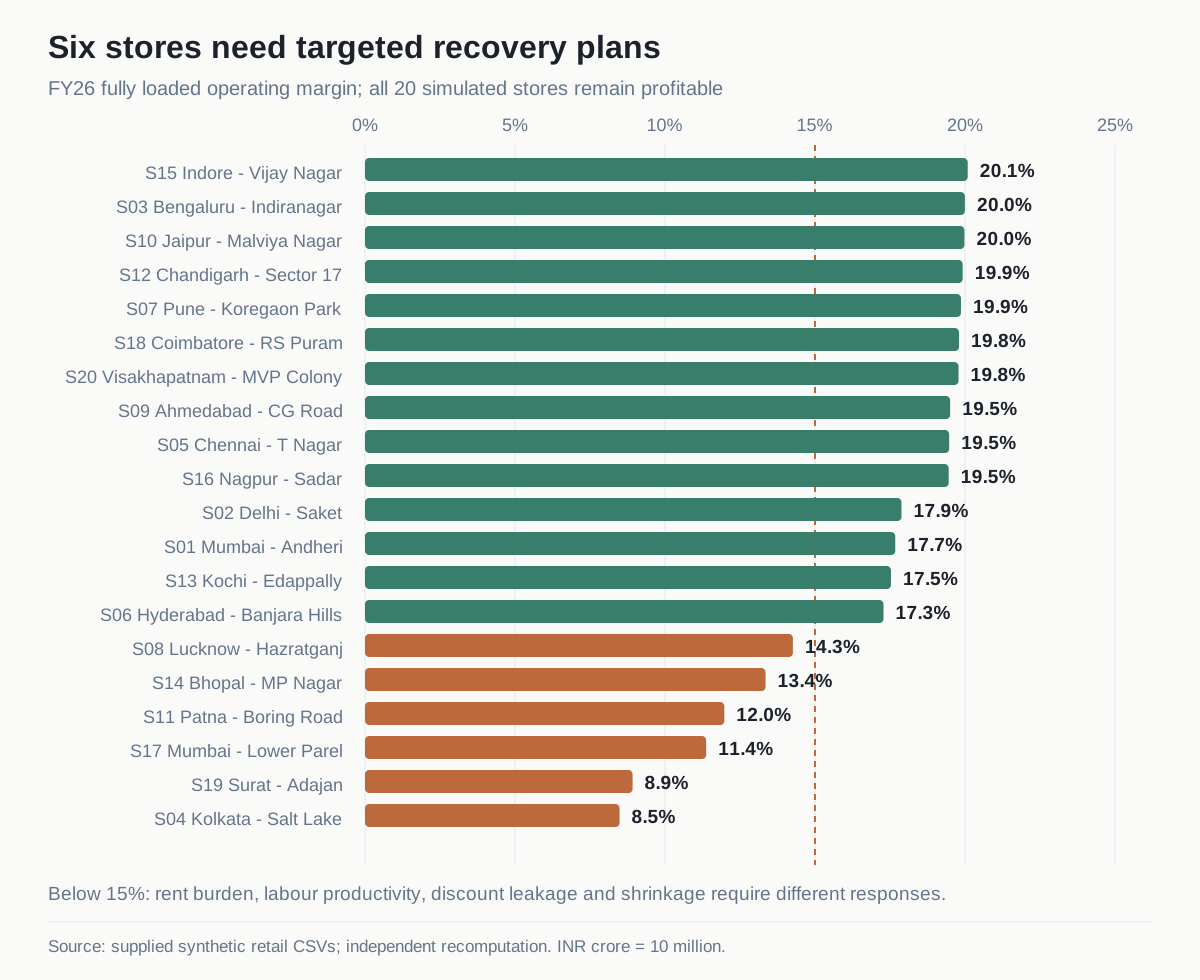
Figure 2. The six-store recovery group has different constraints
The 15% line identifies the report's priority review group. Low margin is a starting point for diagnosis: lease cost, labour productivity, price realisation and shrinkage require different interventions.
Source: Website analysis independently recomputed from the supplied synthetic retail CSVs, April 2024–March 2026. Definitions follow the original Retail Operations Transformation report.
Category growth should be judged by contribution and cash requirements
Packaged Staples and Electronics Accessories account for 29.9% of revenue but just 11.4% of product contribution. Staples contribute only 9.7% of their own sales after freight, write-offs and holding cost; Electronics Accessories contribute 16.5%. These categories also grow quickly in the constructed dataset, which makes revenue growth less profitable at the chain level. Contribution shares describe the retailer's own economics, not market share or a competitive advantage.
Personal Care and Health & Wellness convert a much larger share of revenue into contribution. Apparel and Home & Kitchen retain healthy contribution rates, yet their low turns tie up substantial inventory. Apparel combines a 27.5% average discount with 98 days of inventory; Home & Kitchen holds about 87 days. The decision is therefore two-dimensional: protect attractive contribution while reducing unnecessary stock and avoid assuming that high margin automatically means good cash productivity.
The report treats staples as traffic-driving products, but no basket-level dataset is supplied to prove that role. The proposed policy keeps essential ranges available while testing vendor terms, selective repricing and discount guardrails. Removing a whole category on direct margin alone would ignore possible customer and basket effects that this dataset cannot measure.
Swipe horizontally to view all columns.
| Category | Revenue | Contribution margin | Discount | Inventory turns | Days of inventory |
|---|---|---|---|---|---|
| Packaged Staples | ₹10.00 cr | 9.7% | 5.3% | 14.0× | 26 |
| Beverages & Snacks | ₹7.12 cr | 26.6% | 7.2% | 10.2× | 36 |
| Personal Care | ₹7.05 cr | 48.8% | 9.2% | 7.7× | 47 |
| Apparel | ₹6.98 cr | 41.1% | 27.5% | 3.7× | 98 |
| Health & Wellness | ₹6.18 cr | 43.3% | 8.3% | 7.1× | 52 |
| Electronics Accessories | ₹4.97 cr | 16.5% | 13.5% | 6.9× | 53 |
| Home & Kitchen | ₹4.54 cr | 36.5% | 12.5% | 4.2× | 87 |
| Toys & Stationery | ₹3.15 cr | 43.6% | 12.3% | 6.4× | 57 |
Contribution precedes rent, staff, other store expenses and HQ. Turns = annual COGS ÷ average inventory; days = 365 ÷ turns.
Source: Independent recomputation from the six supplied retail CSV tables using the definitions in the original report and SQL.
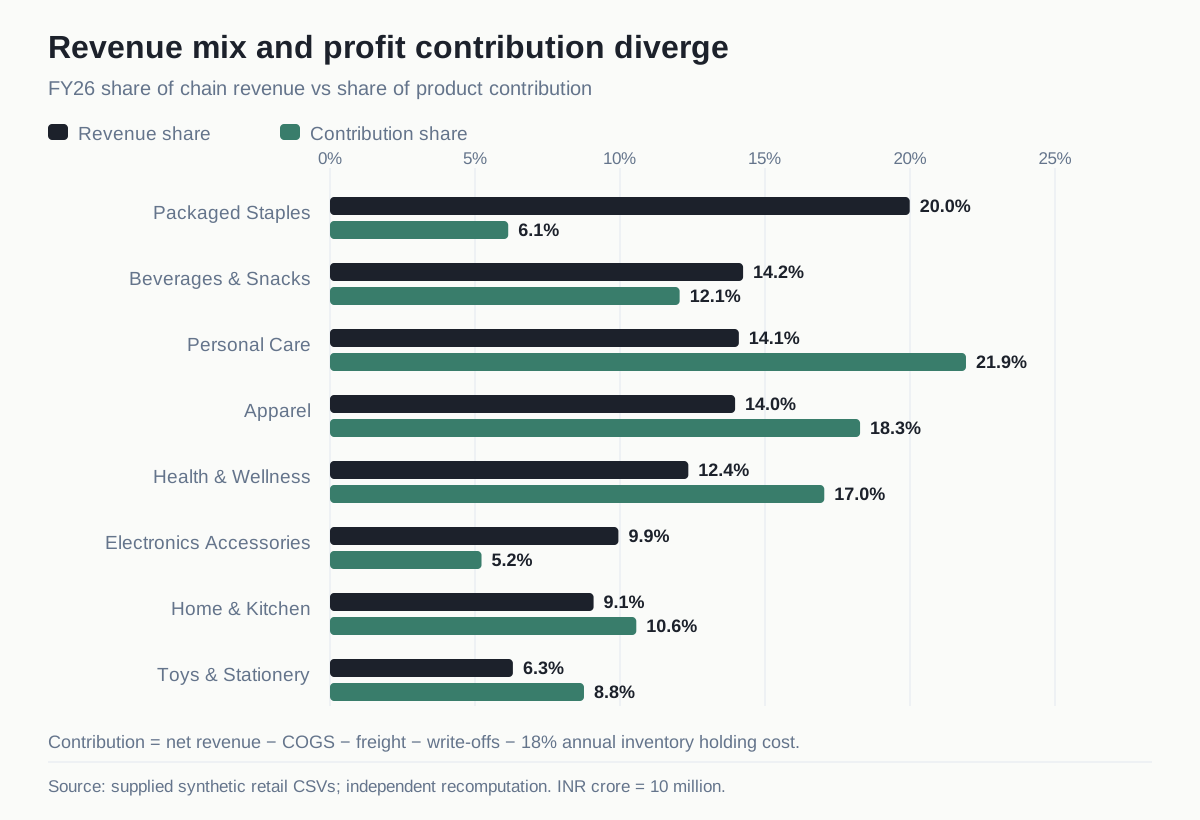
Figure 3. Sales mix and contribution mix tell different stories
Contribution deducts COGS, freight, write-offs and inventory holding cost. It precedes store operating expenses and HQ, so it should guide product decisions alongside basket effects and stock requirements.
Source: Website analysis independently recomputed from the supplied synthetic retail CSVs, April 2024–March 2026. Definitions follow the original Retail Operations Transformation report.
Range decisions become more precise at store–SKU level
Eight SKUs generate about ₹6.2 crore of annual sales while earning less than 8% contribution margin. Four are negative at chain level. The weakest toy line has a gross margin above 50%, yet loses money after its small sales base is charged for freight, write-offs and inventory. This illustrates why gross margin alone is insufficient for assortment decisions.
The scenario applies inventory right-sizing before evaluating range removal. Only 31 of the 1,600 store–SKU lines remain negative after that adjustment, representing four SKUs and approximately ₹0.35 crore of revenue. This ordering prevents the model from delisting products merely because the existing stock policy makes them appear uneconomic. The range model assumes 40% of displaced sales transfer to retained products and a 30% clearance loss on remaining inventory; both assumptions require real-world validation.
Thin-margin staple and accessory lines that remain positive are candidates for supplier negotiation or selective repricing. Negative lines should first be checked for strategic basket roles, local demand, availability and substitution. The analysis supports a review list and controlled range trials, not an automatic nationwide deletion rule.
Swipe horizontally to view all columns.
| SKU | Category | Revenue | Contribution margin | Review priority |
|---|---|---|---|---|
| TOY-09 | Toys & Stationery | ₹0.01 cr | −54.6% | Demand, display minimum and local range role |
| ELE-08 | Electronics Accessories | ₹0.09 cr | −13.0% | Store-level range and stock review |
| STP-01 | Packaged Staples | ₹0.47 cr | −1.4% | Terms, pricing and basket importance |
| ELE-02 | Electronics Accessories | ₹0.46 cr | −0.9% | Terms, pricing and store-level retention |
| STP-04 | Packaged Staples | ₹2.49 cr | 2.9% | High-value supplier negotiation |
| STP-03 | Packaged Staples | ₹0.18 cr | 3.3% | Stock and price discipline |
| ELE-05 | Electronics Accessories | ₹0.95 cr | 4.3% | Supplier cost and markdown review |
| STP-05 | Packaged Staples | ₹1.57 cr | 7.3% | Terms and discount guardrails |
Reported SKU contribution before proposed inventory changes. Negative chain totals and negative individual store–SKU lines are different decision units.
Source: Retail Operations Transformation & Profitability Optimization, supplied 25-page report; synthetic case data, April 2024–March 2026. Table 4.2.
Inventory is misallocated as well as excessive
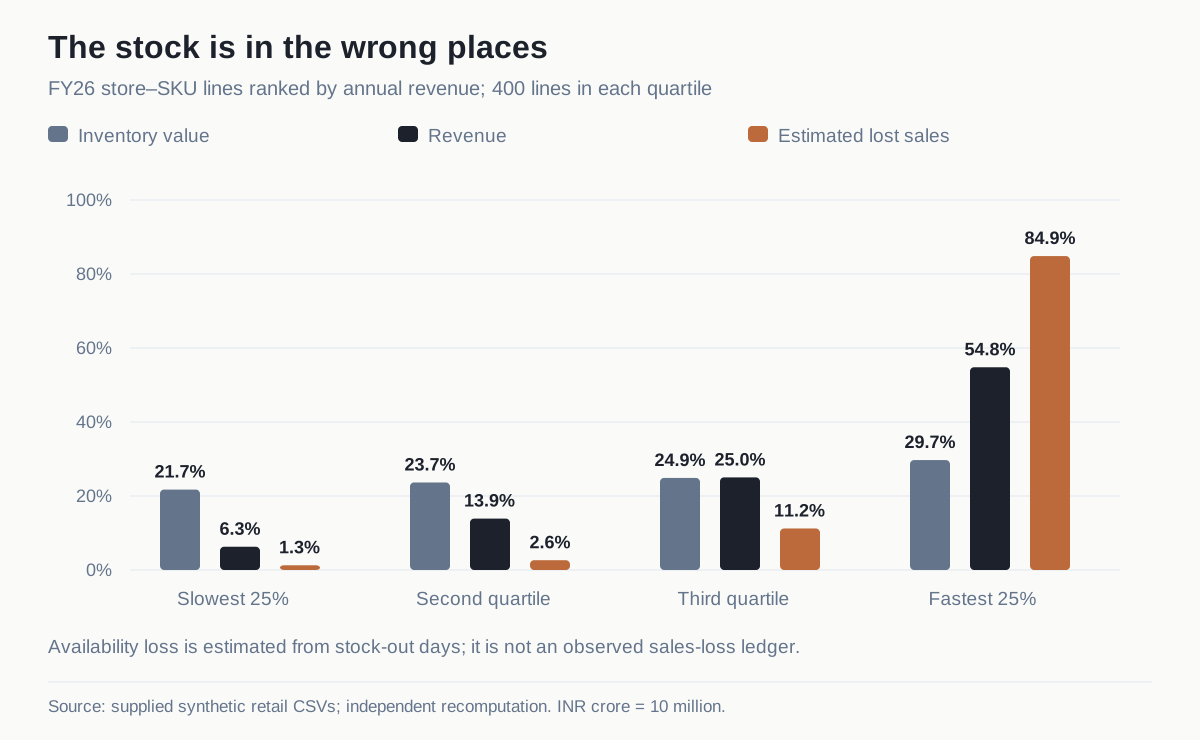
Average inventory rises from ₹3.57 crore to ₹4.47 crore, while turns fall from 8.1× to 7.2× and days of inventory rise from about 45 to 51. Every category slows. Ranking the 1,600 store–SKU lines by annual revenue reveals the underlying allocation problem: the slowest quartile holds 21.7% of inventory for 6.3% of sales, while the fastest quartile generates 54.8% of sales and 84.9% of estimated lost sales from 29.7% of inventory.
The generator applies category-level stock rules and minimum display quantities rather than sizing every line directly to its own demand. That constructed mechanism can leave slow items overstocked and fast items unavailable at the same time. Under the model's demand-based cover targets, 809 store–SKU lines hold more than 1.5 times their target inventory, representing ₹2.51 crore of existing stock. The conclusion is to rebalance stock; simply cutting the chain's inventory budget would leave the availability problem unresolved.
Estimated lost revenue is ₹3.91 crore, or about 7.2% of estimated demand. The estimator divides observed units by in-stock days, extrapolates that rate over stock-out days, and values the result at realised prices. This assumes unmet demand resembles observed in-stock demand and does not fully model substitution or shopping elsewhere. The initiative recovers 40% of those estimated units, releases ₹1.38 crore from excess stock and reinvests ₹0.97 crore into shortages. Inventory rebalancing releases approximately ₹0.41 crore net; the subsequent assortment exit adds about ₹0.05 crore, taking programme working-capital release to ₹0.46 crore.
Swipe horizontally to view all columns.
| 400 store–SKU lines per quartile | Inventory share | Revenue share | Estimated lost-sales share |
|---|---|---|---|
| Slowest quarter | 21.7% | 6.3% | 1.3% |
| Second quarter | 23.7% | 13.9% | 2.6% |
| Third quarter | 24.9% | 25.0% | 11.2% |
| Fastest quarter | 29.7% | 54.8% | 84.9% |
Quartiles are ranked by FY26 revenue at store–SKU level. Lost-sales shares describe a modelled estimate, not observed customer transactions.
Source: Independent recomputation from the six supplied retail CSV tables using the definitions in the original report and SQL.
Figure 4. Availability and excess stock coexist
Each quartile contains 400 store–SKU lines ranked by FY26 annual revenue. The analysis supports reallocating stock from slow to fast lines rather than applying one uniform inventory cut.
Interpretation: Lost sales are estimated by extrapolating observed units per in-stock day over stock-out days. They are not an observed customer-demand ledger.
Source: Website analysis independently recomputed from the supplied synthetic retail CSVs, April 2024–March 2026. Definitions follow the original Retail Operations Transformation report.
Seven initiatives link the diagnosis to bottom-up economics
Demand-driven replenishment is the largest proposed intervention. The base model combines recovered sales contribution, reduced write-offs and a modest holding-cost saving, then deducts ₹0.10 crore of annual running cost. Category cover targets range from 20 days for Staples to 70 days for Apparel, with a minimum of four units at each store–SKU line. Only 75% of calculated excess stock is assumed releasable. These constraints acknowledge commitments and practical stock floors without claiming they have been tested with an actual supply chain.
Discount governance separates store-level leakage from category-wide discount creep. The model recaptures 70% of local leakage at an assumed price elasticity of 0.5 and 35% of category creep at 1.5, against a category guardrail of the FY25 discount rate plus two percentage points. Benefits are net of estimated volume loss. Vendor terms assume a 1% saving on retained Staples, Electronics Accessories and Beverages COGS. These are negotiation and customer-response assumptions, not achieved savings.
Labour targets use 90% of median revenue per FTE, a 4.5-FTE floor and 60% capture through attrition, with a 3% roster saving elsewhere. The result corresponds to approximately 7.6 FTE of captured capacity change across six stores. Rent assumes a 12% reduction with 60% negotiation success at the two stores above 8% rent-to-sales. Shrinkage uses a process intervention at Patna and Bhopal; the more expensive EAS/CCTV option is rejected by the detailed economics. This resolves an earlier report archetype that mentions technology as a possible response.
The model first changes inventory, then evaluates remaining negative lines and applies pricing and vendor calculations to retained lines. It also charges one-time clearance, redeployment and setup costs. This treatment reduces important overlaps. A real programme would still need a common benefits ledger to prevent two owners from claiming the same improvement and to distinguish avoidable cash savings from allocated accounting charges.
Swipe horizontally to view all columns.
| Initiative | Gross annual benefit | Annual running cost | Net annual benefit | One-time cost |
|---|---|---|---|---|
| Demand-driven replenishment | 0.669 | 0.100 | 0.569 | 0.369 |
| Store-level assortment trim | 0.031 | 0.000 | 0.031 | 0.074 |
| Discount and markdown governance | 0.182 | 0.030 | 0.152 | 0.100 |
| Labour productivity and rostering | 0.191 | 0.050 | 0.141 | 0.151 |
| Shrinkage process controls | 0.015 | 0.010 | 0.005 | 0.020 |
| Rent renegotiation | 0.042 | 0.000 | 0.042 | 0.030 |
| Vendor terms | 0.172 | 0.000 | 0.172 | 0.060 |
| Total | 1.302 | 0.190 | 1.112 | 0.804 |
Three decimal places preserve the small shrinkage benefit that rounds to 0.00 in the report. Totals use unrounded values. These are steady-state assumptions, not first-year cash flows.
Source: Independent deterministic recomputation of the supplied scenario assumptions; reconciled to report Table 6.2.
The investment works in the base case, but the downside changes the decision
The base programme requires ₹0.80 crore upfront and ₹0.19 crore in annual running cost. Initiative-specific ramps produce net cash flows of approximately ₹0.36 crore, ₹0.98 crore and ₹1.11 crore in years one to three. Discounted at 12%, the three-year NPV is ₹1.09 crore and cumulative undiscounted cash breaks even after approximately 17 months. The model excludes the ₹0.46 crore working-capital release from NPV because the carrying charge already includes capital cost; that release is reported separately as a cash memo item.
Recovered sales, assortment changes and price-volume effects increase base-case annual revenue to ₹51.24 crore. Operating profit reaches ₹9.61 crore, so the correct modelled margin is 18.8%, not 19.2% calculated against the unchanged ₹50 crore baseline. The detailed report uses the changing denominator; an executive slide does not. The 1.8-point improvement recovers about 57% of the original margin decline and leaves further performance work unresolved.
Conservative delivery assumes 70% of gross benefits, a 15% cost overrun and a slower first-year ramp. Its three-year NPV is only ₹0.09 crore and payback extends to 29 months. Stress delivery assumes 45% of benefits, 30% higher costs and a slower multi-year ramp; NPV falls to −₹0.80 crore, with no payback inside five years. Although its nominal full-delivery run-rate benefit is ₹0.34 crore, the stress ramp reaches only 90% of that benefit schedule, leaving year-three annual cash benefit near ₹0.28 crore. Staged funding is therefore material to the investment logic.
Swipe horizontally to view all columns.
| Measure | Base | Conservative | Stress |
|---|---|---|---|
| Gross-benefit delivery / cost overrun | 100% / 0% | 70% / +15% | 45% / +30% |
| One-time investment | ₹0.80 cr | ₹0.92 cr | ₹1.05 cr |
| Nominal annual net run-rate benefit | ₹1.11 cr | ₹0.69 cr | ₹0.34 cr |
| Modelled revenue at nominal run rate | ₹51.24 cr | ₹50.87 cr | ₹50.56 cr |
| Operating margin at nominal run rate | 18.8% | 18.1% | 17.5% |
| Year-three net cash benefit after ramp | ₹1.11 cr | ₹0.69 cr | ₹0.28 cr |
| Three-year NPV at 12% | ₹1.09 cr | ₹0.09 cr | −₹0.80 cr |
| Five-year NPV at 12% | ₹2.43 cr | ₹0.92 cr | −₹0.46 cr |
| Undiscounted payback | 17 months | 29 months | Beyond five years |
Five-year NPV holds years four and five at the year-three cash-flow level. No benefit decay, inflation or tax is included; the longer view is consequently more optimistic.
Source: Independent deterministic recomputation; original report Tables 6.3 and 6.4. Margins use each scenario's modelled revenue denominator.
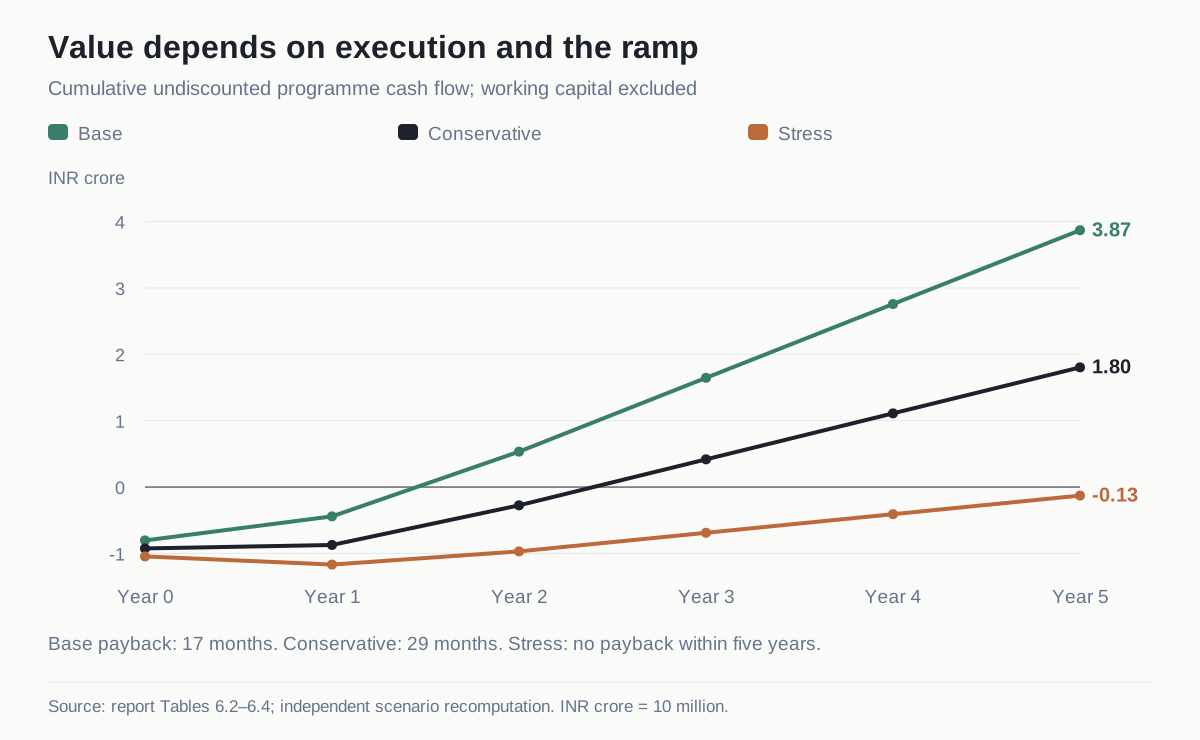
Figure 5. The downside case does not recover its investment in five years
These are undiscounted cumulative cash flows after upfront and annual running costs, using the report's initiative ramps. They are distinct from NPV, which discounts those flows at 12%.
Interpretation: Working-capital release is excluded. Years four and five retain the year-three cash-flow level, including the stress scenario's 90% ramp factor.
Source: Independent deterministic recomputation of the report's seven initiative benefits, costs and ramps; reconciled to detailed scenario Tables 6.2–6.4.
Test the assumptions that can overturn the recommendation
The programme needs approximately 54% of modelled gross benefits to reach zero three-year NPV at budgeted costs. With a 30% cost overrun and the stress ramp, that requirement rises to about 88%. The most consequential uncertainties are the proportion of stock-out demand that is recoverable and the price response to discount changes. These are causal questions that descriptive SQL cannot resolve.
The report's 20,000-run Monte Carlo varies initiative delivery from 40% to 120% using triangular distributions, applies a shared execution factor of 85%–110%, and varies cost from 95% to 150% of budget. It reports 96% of draws with positive three-year NPV and net-benefit percentiles of ₹0.70, ₹0.89 and ₹1.06 crore. This is a sensitivity result conditional on chosen distributions. It is not an empirically validated 96% probability of success; the ₹1.11 crore base case sits near the optimistic end of those benefit draws.
The proposed validation programme uses four inventory pilot stores, including two flagged and two healthier stores, plus an eight-week matched-store pricing test. The design should preserve manual replenishment overrides, track availability and customer response, and compare equivalent trading periods. Supplier savings need documented terms; labour savings need payroll or redeployment evidence; carrying-cost improvements need a reconciliation between accounting benefit and avoidable cash. No such pilots or negotiations were conducted in this simulation.
Swipe horizontally to view all columns.
| Assumption | Proposed test | Decision safeguard |
|---|---|---|
| 40% of estimated lost units are recoverable | Four-store replenishment pilot with POS and availability checks | Fill rate ≥95%, stock cover −10%, and no sales deterioration |
| Lower discounts retain enough demand | Eight-week matched-store price test; compare units and contribution | Stop or adapt if lost volume offsets the price benefit |
| Labour can be captured through attrition | Roster to hourly footfall and monitor service, conversion and payroll | 4.5-FTE floor; maintain conversion and service quality |
| Vendors accept net cost reductions | Signed category-level terms and availability monitoring | Preserve critical staples supply; verify net landed cost |
| Rent savings are negotiable | Lease-specific negotiation at S04 and S17 | Treat savings as contingent; review again at lease events |
These are proposed gates derived from the case study, not measured pilot results.
Source: Retail Operations Transformation & Profitability Optimization, supplied 25-page report; synthetic case data, April 2024–March 2026. Sections 6–7 and Appendix A.
Turn the analysis into a recurring operating conversation
The study ends with a Power BI specification rather than a deployed dashboard. Five pages would cover executive performance, store economics, product contribution, stock and availability, and scenario assumptions. The executive view would connect margin and discount trends with store rankings, inventory turns and the velocity-quartile mismatch. Store drill-through would help operations teams see whether an issue is lease cost, staffing, shrinkage, availability or price realisation.
Before implementation, the model needs a proper calendar and fiscal-year dimension, unique relationship keys and reconciled HQ allocations. The report's suggested direct HQ-to-month relationship does not provide a simple many-to-one relationship because fiscal year repeats across months; a fiscal-year dimension or explicit annual allocation is needed. Measures should also retain complete-year denominators when calculating annual inventory costs and avoid reallocating company HQ merely because a user filters the store view.
A monthly benefits review would assign one accountable owner per initiative, compare actual implementation cost with the budget, reconcile operational measures to the P&L and record exceptions. The analytical contribution is the traceable chain from raw tables to diagnosis, intervention assumptions, cash flows and scale gates. The report, all six original datasets and SQL analysis are downloadable for readers who want to inspect the work in detail. No Power BI file or Excel companion was supplied, so neither is presented as a finished deliverable.
- Commercial: operating margin, gross margin and discount rate against the FY25-based category guardrail.
- Inventory: turns, days of inventory, availability, estimated lost-sales share and stock exceptions.
- Stores: sales per labour hour, conversion, shrinkage at Patna/Bhopal and rent burden at Kolkata/Lower Parel.
- Programme: realised benefit, upfront and running costs, service safeguards and evidence for the next funding gate.
Strategic priorities
Prove demand-driven stock allocation
Pilot four stores before a chain rollout. Release excess slow stock while funding fast-line availability, and track contribution alongside fill rate and sales.
Protect price realisation with evidence
Use category guardrails and exception approvals, then test elasticity in matched stores before scaling. Pair pricing discipline with targeted vendor negotiations.
Give each weak store the right recovery plan
Use lease negotiations at rent-heavy malls, footfall-led rostering at low-productivity stores, and process-based shrinkage controls at the two hotspots.
Fund the programme against measured gates
Release the proposed ₹0.80 crore budget in waves. Keep peer-gap benchmarks, working-capital releases and recurring P&L benefits separate in the benefits ledger.
Path to implementation
Proposed sequencing and decision gates.
Months 0–3 · proposed
Establish controls and open negotiations
Pricing and Procurement test discount guardrails and vendor terms; Property begins S04/S17 lease discussions; Store Operations introduces process controls at S11/S14. Establish the baseline and initiative owners.
Decision gate: Category discount rate at or below FY25 +2 pp where commercially validated; shrinkage at S11/S14 below 1.1%; evidence recorded before further budget release.
Months 3–9 · proposed
Pilot stock allocation and reset operating routines
Supply Chain runs the four-store inventory pilot; Store Operations tests footfall-led rosters and attrition-led capacity changes; Category reviews the remaining negative store–SKU lines.
Decision gate: Month-six inventory review: fill rate ≥95%, cover reduced 10%, no sales deterioration and service preserved. Scale only with reconciled economics and operational adoption.
Months 9–15 · proposed
Scale the proven changes
Extend the replenishment policy only after pilot approval, embed monthly exception reviews, and revisit rent-heavy stores at lease events. Reforecast the investment case using observed delivery and cost.
Decision gate: Proposed sales-per-labour-hour target of at least ₹1,428 in the six-store review group, with maintained conversion; release remaining funding against realised contribution and service gates.
Value and measurement
Completed outputs comprise a 25-page report with an embedded executive presentation, a reproducible six-table synthetic dataset, SQL analysis, a seven-initiative scenario model, downside tests, an operating roadmap and a Power BI specification. Independent website recomputation reconciles the principal baseline and deterministic scenario figures. The ₹1.11 crore annual benefit, 18.8% margin, ₹1.09 crore NPV and 17-month payback are modelled proposals; no store intervention, live dashboard, supplier saving or verified profit uplift was delivered.
Explore the evidence
Datasets & further reading
Download the source material to explore the analysis, inspect model assumptions, and read the full study.
Complete reading package
The original report, all six datasets, SQL queries and a guide in one archive. Python scripts and system metadata are omitted.
ZIP · 2.21 MB
- Download PDF, 1.48 MB
Full report & executive presentation
Original 25-page study with financial diagnostics, figures, assumptions, scenario economics and the Power BI specification.
Report · PDF · 1.48 MB
- Download ZIP · 6 CSVs, 1.06 MB
Complete retail datasets
All six original CSV tables, including 38,400 sales/inventory records, with a reading guide and reconciliation notes.
Dataset · ZIP · 6 CSVs · 1.06 MB
- Download SQL, 5.2 KB
SQL analysis queries
Original SQLite analytical views and queries. Load the supplied CSVs into matching table names before running the analysis.
Supporting document · SQL · 5.2 KB
Sources and scope
Operating problems are engineered in synthetic data, so gap sizes are properties of the case design. Lost sales are extrapolated rather than observed. Basket effects, elasticity, supplier terms, lease constraints, payroll capture and adoption remain untested. The model includes an assumed holding charge, allocated HQ and no tax, inflation or benefit decay. Monte Carlo results depend on chosen distributions. The website reconciles several source inconsistencies: five regions rather than four; changing-revenue margins of 18.8%/18.1%/17.5%; and estimated lost gross margin of ₹1.28 crore under the supplied SQL method, compared with a ₹1.20 crore report headline. Original downloadable files remain unchanged.
- Original report and executive presentation (opens in a new tab)
25-page supplied PDF, including diagnostics, initiative economics, three scenarios, assumptions and dashboard specification. Preserved unchanged.
- Complete synthetic retail dataset (opens in a new tab)
Six unchanged CSV tables: sales/inventory, store operations, HQ costs, store, SKU and date dimensions; April 2024–March 2026.
- Original SQL analysis (opens in a new tab)
SQLite views and queries for P&L, store ranking, productivity, category and SKU contribution, inventory and monthly trends.
Scenario assumptions and model provenance
Report Sections 6–7 and Appendix A, supported by the supplied scenario definitions and synthetic-data generator. Website figures use independently reconstructed calculations.
Independent reconciliation
Website charts recalculate central findings from the supplied CSVs. Detailed scenario tables take precedence over inconsistent executive-slide margins; all figures retain synthetic and modelled status.
Continue reading
Related case studies
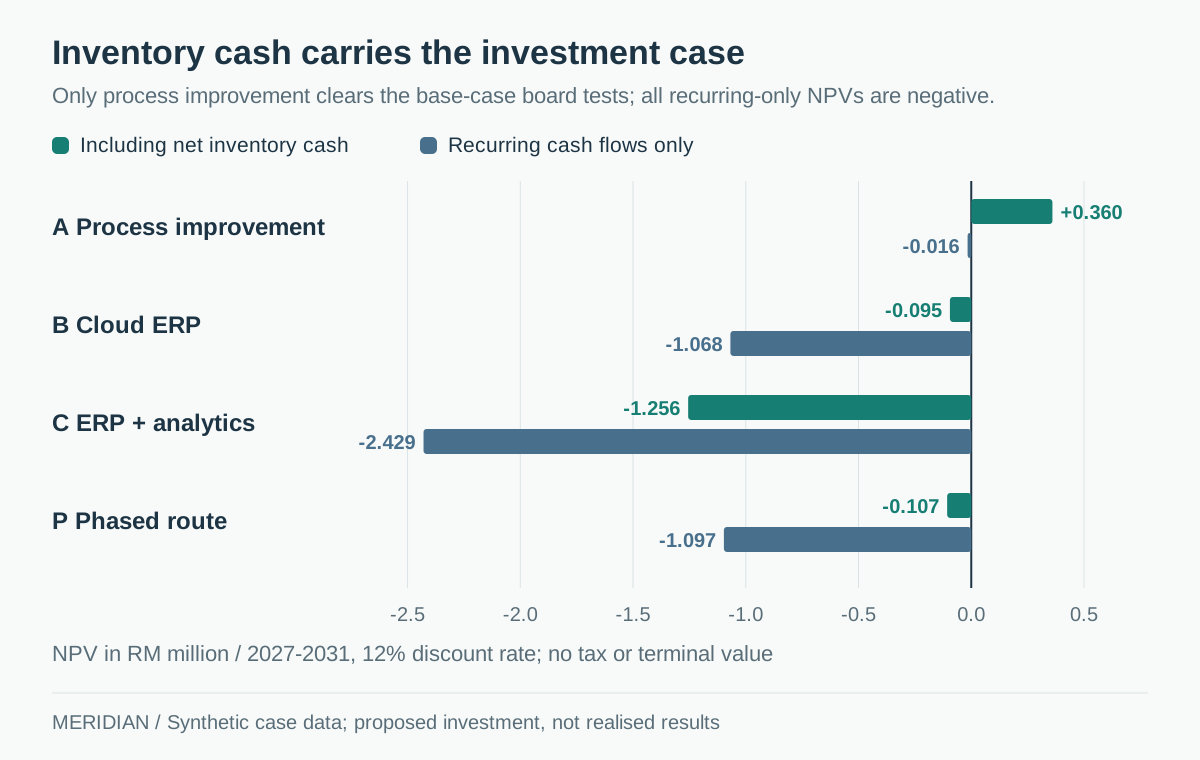
ERP investment / Operations transformation / Financial modelling
Meridian Precision Components: Make the ERP earn its place
A process-first manufacturing transformation strategy that tests an ERP investment against operational evidence, working-capital economics and production risk.
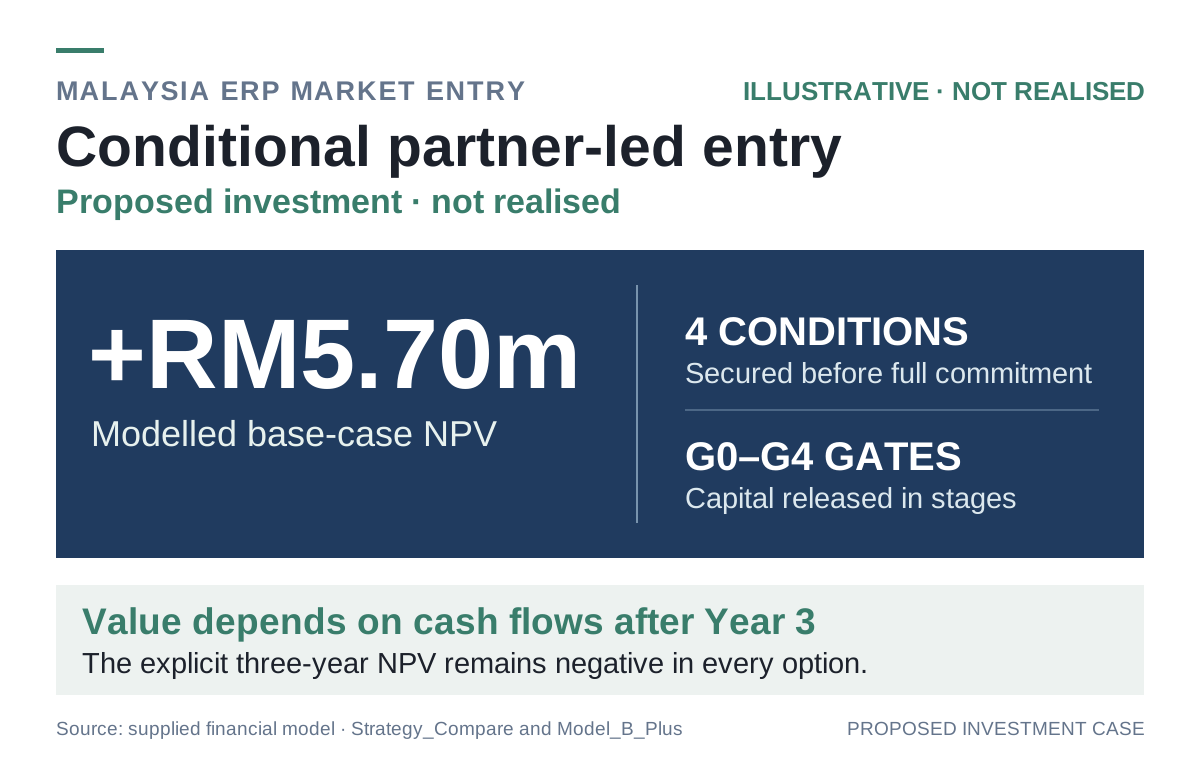
Market entry / Enterprise software / Investment modelling
Malaysia ERP market entry: a stage-gated partnership
A market-entry assessment for an illustrative Indian software company, connecting market sizing and customer focus to a conditional, capital-gated investment case.
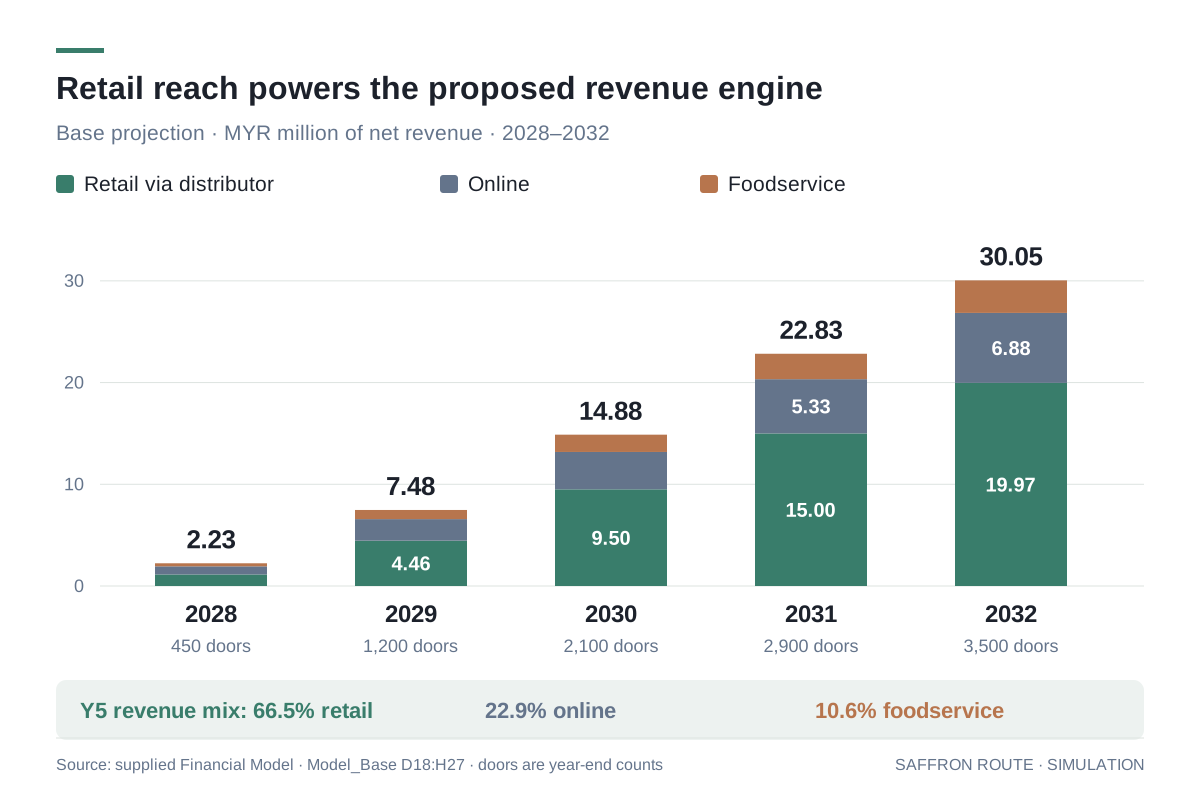
Market entry / Financial modelling / Commercial strategy
Saffron Route Foods: a staged route into Malaysia
An evidence-led market-entry case connecting consumer segmentation, distributor economics and a five-year financial model to explicit investment gates.