Commercial analytics / Portfolio strategy / Business intelligence
Turn GBI’s sales concentration into a disciplined growth portfolio
A sales analytics case that separates portfolio concentration from profitability and designs a measurable dealer growth programme.

The recommendation
Manage incremental profit, dealer behaviour and data quality together.
GBI should protect its Touring franchise while testing selective Off-Road growth with dealers. The revised analysis reports that Touring contributes 82.18% of bicycle revenue, while Off-Road contributes 17.82% at a 50.17% gross margin. That is a concentration question and a growth hypothesis, not evidence that Off-Road is loss-making or that an equal product mix is optimal. Establish a trusted commercial baseline, investigate dealer barriers and scale interventions only when incremental contribution justifies the cost.
Decision at stake
Where to invest in Off-Road growth, how to protect the core business, and which evidence would justify scaling a dealer intervention.
An individual Business Intelligence Systems study of the fictional GBI enterprise dataset, covering finished bicycle sales from 2006 to June 2013. Historical findings support a proposed commercial programme.
Evidence and decision parameters
- Touring revenue share
- 82.18%
- Revised report: US$315.05M across the historical bicycle-only dataset, 2006–June 2013.
- Off-Road revenue
- $68.33M
- Revised report: 17.82% of bicycle revenue and 21.17% of units over the same period.
- Off-Road gross margin
- 50.17%
- Reported gross margin versus 53.16% for Touring; indirect and campaign costs are excluded.
Start with the economics of the existing portfolio
A category generating most revenue can be a strategic strength and a source of exposure. The assignment’s question was whether GBI relied too heavily on Touring Bikes and how business intelligence could improve Off-Road performance. The decision needs a sharper objective: grow total contribution while preserving customer service and the economics of the successful category.
The revised report describes 47,992 transactions, with 25,767 Finished Bike records retained after excluding accessories and safety gear. This consistent scope matters: comparing bicycle revenue with a broader product denominator would distort the concentration diagnosis. The analysis covers 2006 to June 2013 and should be interpreted as a historical simulation.
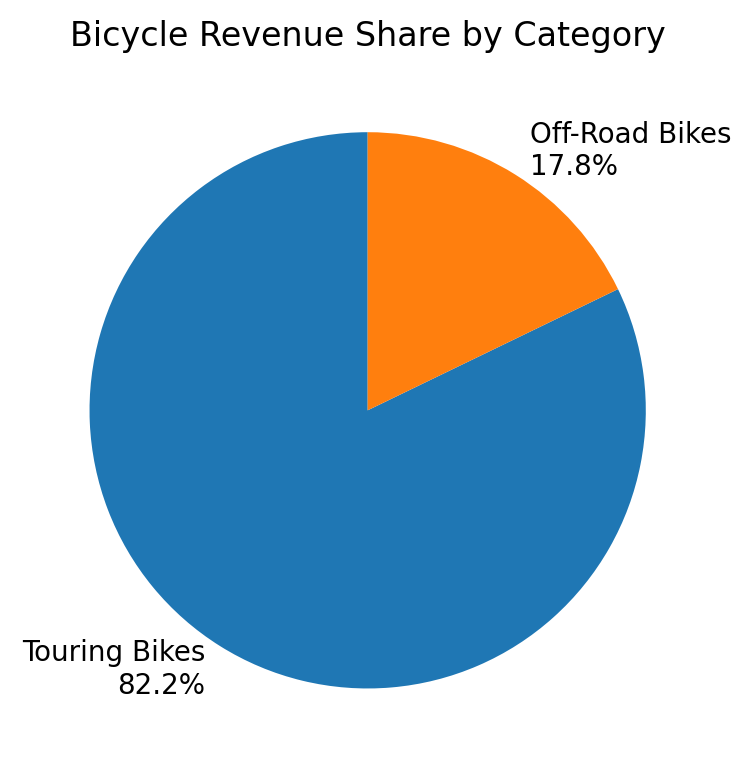
Figure 1. Touring accounts for most bicycle revenue
The original category revenue chart establishes the concentration question: Touring accounts for 82.18% of bicycle revenue, rounded to 82.2% in the chart. These are shares of GBI's own historical sales, rather than competitive market shares.
Source: Original chart from GBI_BIS_Report_Roshmeet_Revised.docx, Roshmeet Chakraborty. Academic GBI simulation; bicycle sales, 2006–June 2013.
Off-Road has a smaller footprint, with positive gross contribution
Touring accounts for US$315.05 million and Off-Road US$68.33 million in the revised report. Off-Road’s 21.17% unit share exceeds its 17.82% revenue share, indicating lower realised revenue per unit. Its 50.17% gross margin also trails Touring’s 53.16%. Together these measures distinguish volume, selling value and margin; any improvement plan should identify which lever it is changing.
The category remains commercially material at gross-profit level. However, gross margin does not establish net profitability once dealer support, warranty, distribution and promotion costs are considered. The smallest reported product contribution is the Women’s Off Road Bike at 7.50% of bicycle revenue. This justifies further diagnosis, rather than an automatic discontinuation or discount decision.
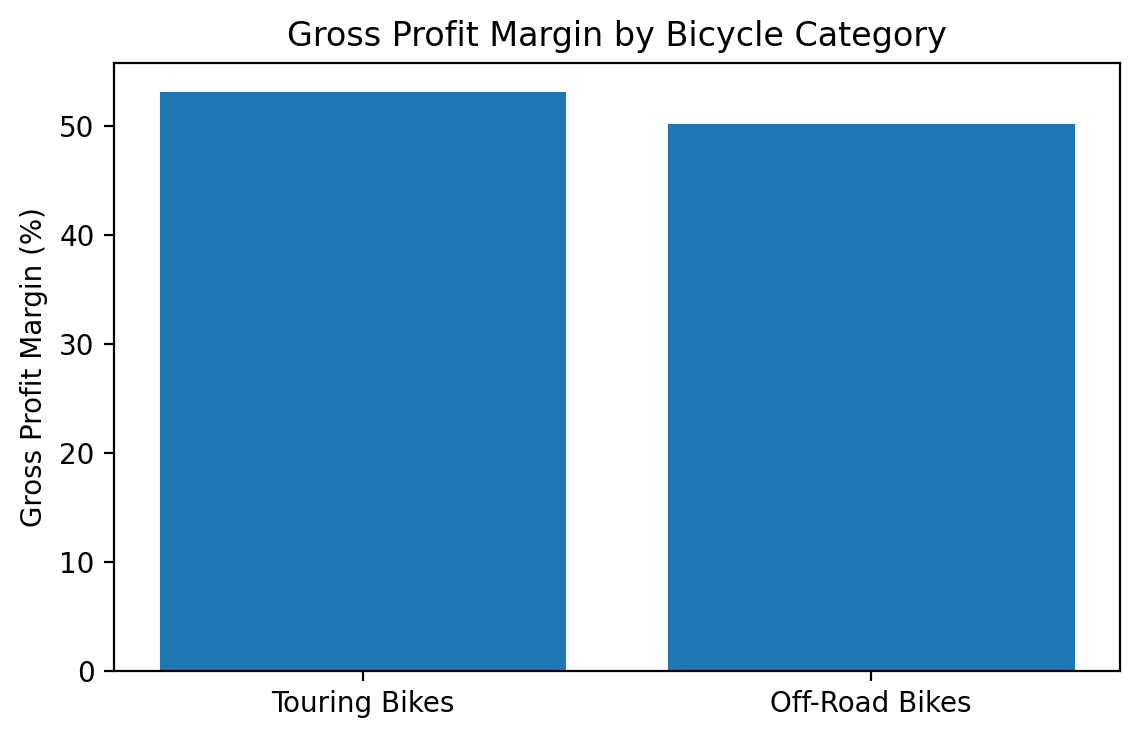
Figure 2. Off-Road retains positive gross contribution
The original gross-margin comparison shows a smaller margin for Off-Road, with positive gross contribution in both categories. Dealer support, distribution, warranty and campaign costs still need to be assessed before making a net-profit or investment decision.
Source: Original chart from GBI_BIS_Report_Roshmeet_Revised.docx, Roshmeet Chakraborty. Academic GBI simulation; bicycle sales, 2006–June 2013.
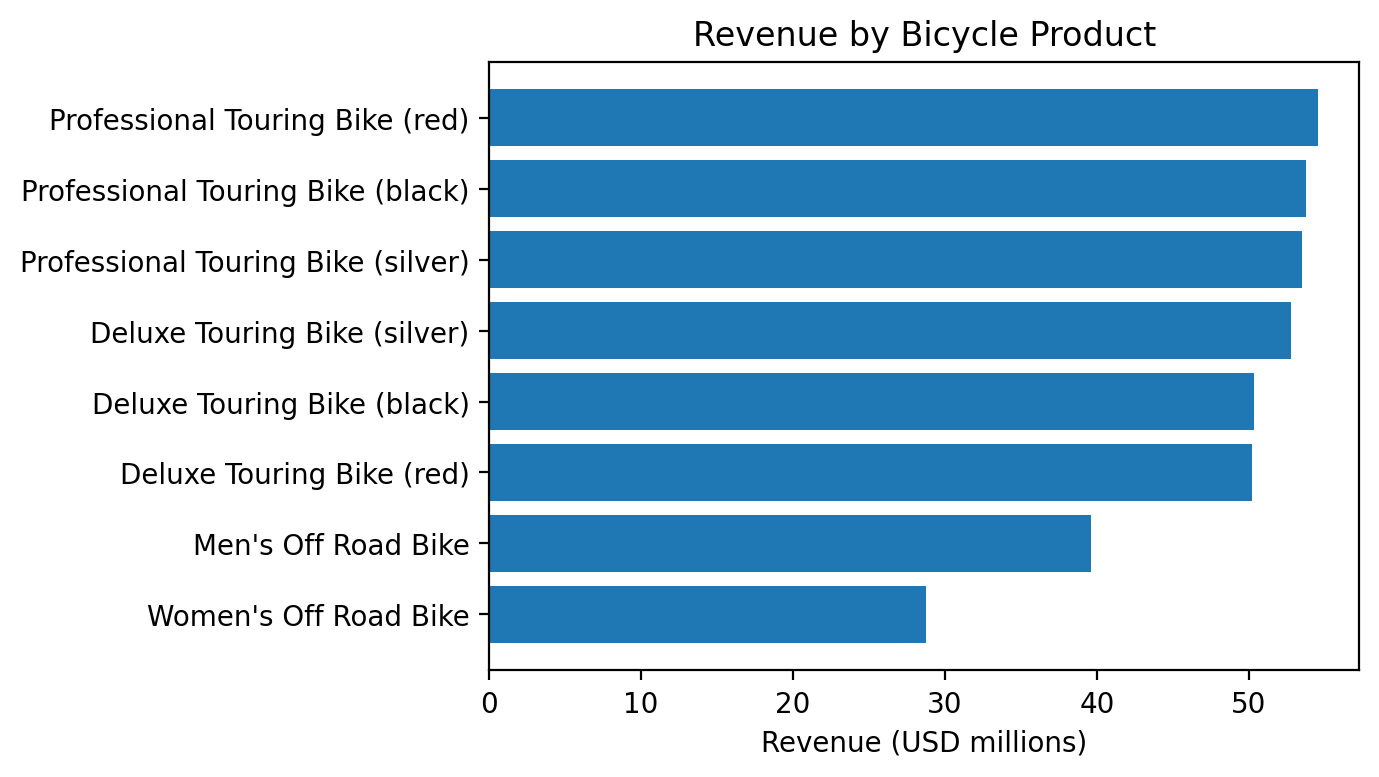
Figure 3. Product-level revenue sharpens the diagnosis
The product breakdown identifies where further investigation should begin. The Women's Off Road Bike has the smallest revenue contribution; the chart alone does not distinguish demand, availability, selling price or dealer execution as the cause.
Source: Original chart from GBI_BIS_Report_Roshmeet_Revised.docx, Roshmeet Chakraborty. Academic GBI simulation; bicycle sales, 2006–June 2013.
Challenge the explanations before funding the solution
German sales organisations show higher Off-Road revenue shares than the US organisations, while the US generates more absolute Off-Road revenue. These are different signals: relative mix can guide peer comparison, whereas absolute contribution can indicate commercial scale. Neither proves that a territory has poor dealer coverage, low customer interest or a positioning problem.
The revised report shows the lowest pooled revenue in Q3. Yet the dataset ends in June 2013, giving quarters unequal exposure. Raw totals cannot establish a seasonal downturn without complete-year or comparable-period analysis. The portfolio rewrite therefore replaces an immediate Q3 campaign conclusion with a requirement to validate recurring patterns, stock availability and dealer order timing.
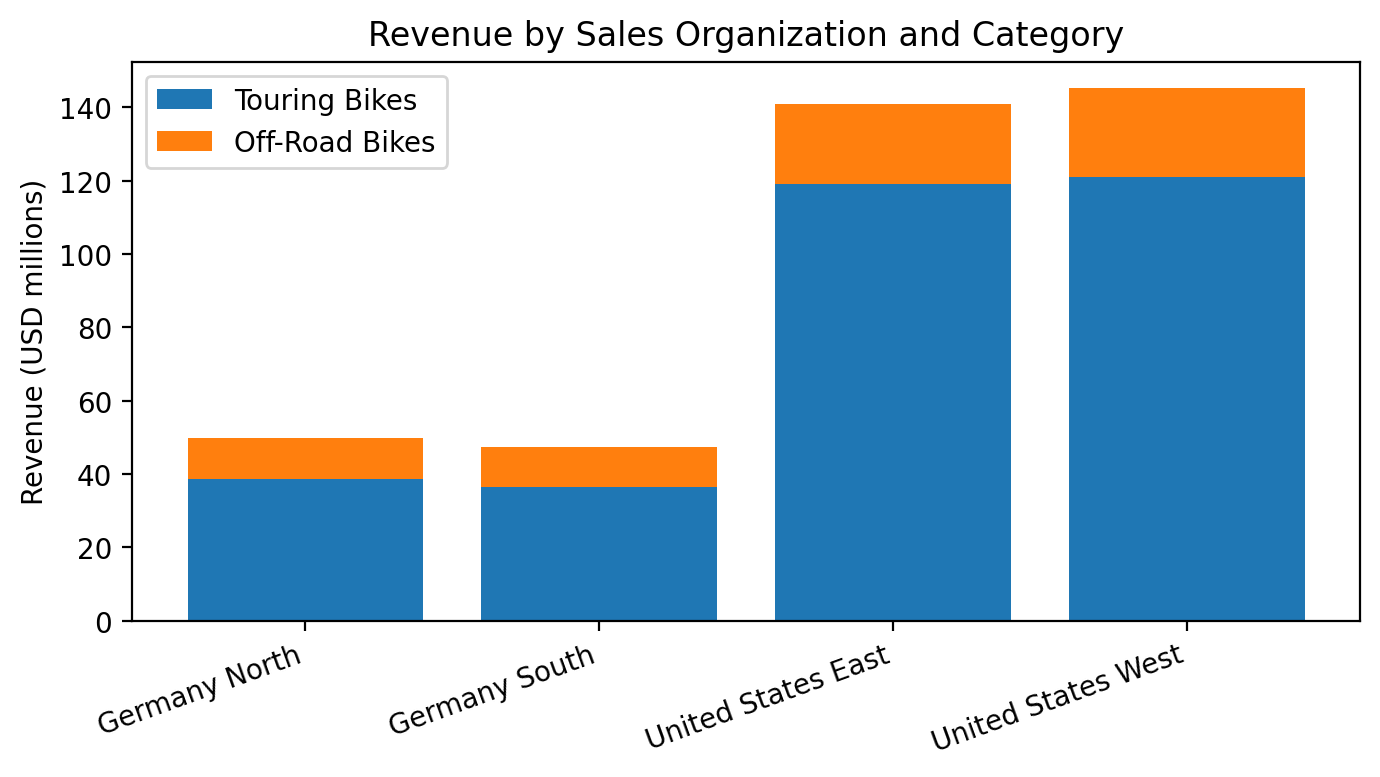
Figure 4. Compare absolute scale with local category mix
US sales organisations generate more absolute Off-Road revenue, while German organisations have a higher Off-Road share of their own sales. Territory mix and absolute commercial scale answer different questions; neither establishes the underlying dealer or customer barrier.
Source: Original chart from GBI_BIS_Report_Roshmeet_Revised.docx, Roshmeet Chakraborty. Academic GBI simulation; bicycle sales, 2006–June 2013.
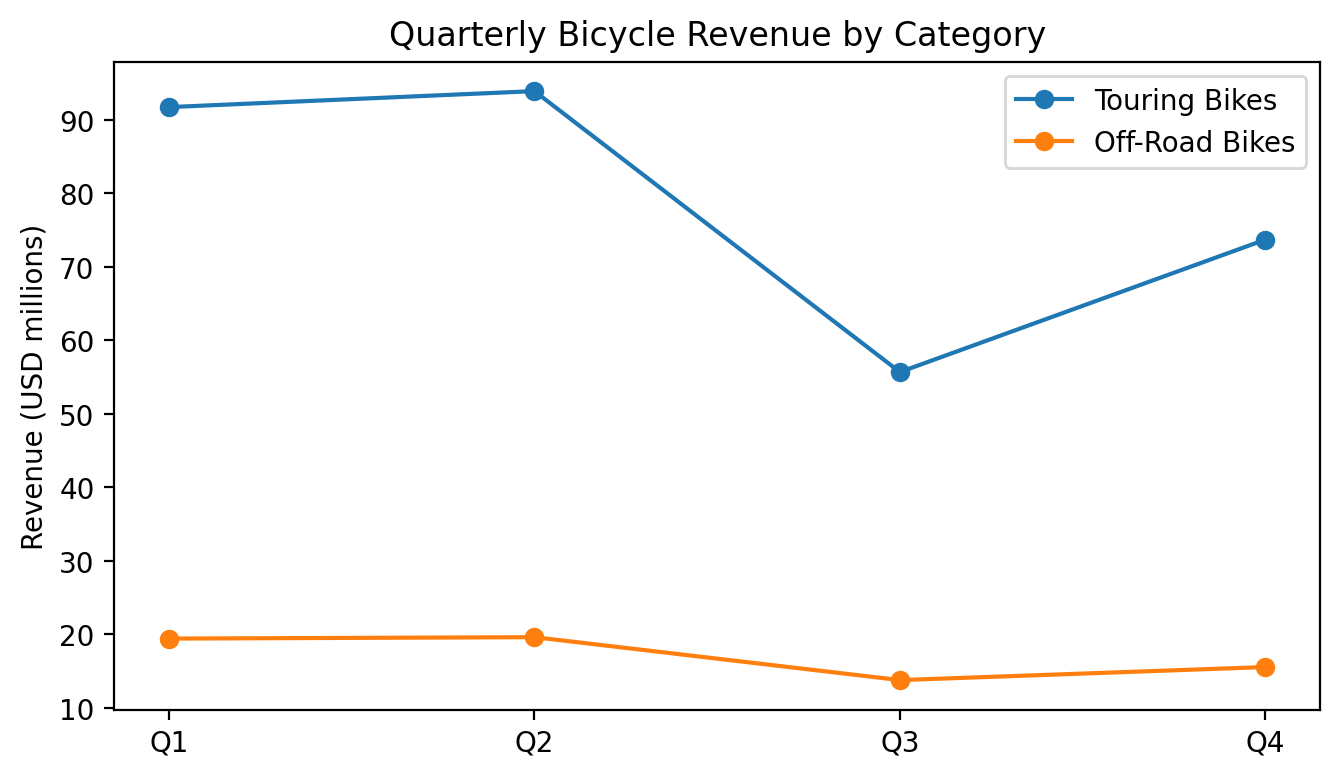
Figure 5. Pooled quarter totals require comparable-period validation
The original chart pools quarter totals across 2006–June 2013. Because the dataset ends in June, Q1 and Q2 include a different number of reporting periods from Q3 and Q4. These unequal-period totals cannot establish seasonality or justify a Q3 campaign.
Interpretation: Interpretation limit: compare complete years or equivalent reporting periods, and test stock availability and dealer order timing before treating the apparent Q3 dip as a recurring demand pattern.
Source: Original chart from GBI_BIS_Report_Roshmeet_Revised.docx, Roshmeet Chakraborty. Academic GBI simulation; bicycle sales, 2006–June 2013.
Choose a bounded experiment over a forced mix target
Maintaining the current portfolio protects an established revenue base but leaves potential Off-Road opportunities unexplored. Broad discounting could lift volume while weakening contribution and brand positioning. Dealer recruitment or product redesign could help, but both require evidence about local demand, channel economics and product objections that the historical transactions do not provide.
The preferred first move is a targeted dealer pilot pairing product training, demonstration availability or improved display with explicit measurement. Interview stronger and weaker dealers to select the intervention. Within-company revenue share is not competitive market share: a BCG growth-share classification requires external market evidence that these records do not provide.
Build a management routine around the dashboard
The proposed BI design has a transaction-level sales fact table and controlled product, dealer, geography and date dimensions, consistent with Microsoft’s dimensional modelling guidance. Finance should approve revenue and gross-profit definitions; category mappings and partial periods need visible treatment. Aggregate gross margin must use total profit divided by total revenue, avoiding an unweighted average of transaction percentages.
The sales review should connect every exception to an owner and next action. Combine revenue, units and margin with dealer participation, stock availability, enquiries and demonstration conversion. Review a dealer’s context before changing incentives. Forecasting and automated alerts should follow a reconciled baseline and outperform a simple seasonal benchmark before influencing inventory or campaign decisions.
Prove that growth adds economic value
Compare participating dealers with a credible matched or randomised comparison group over equivalent selling periods. Track incremental gross profit after incentives, campaign costs and demonstration support, alongside inventory ageing and any displacement of Touring sales. Separate orders shipped into the channel from consumer sell-through when data becomes available.
The revised report proposes growth and mix targets, but these need a coherent revenue bridge: category share depends on both Off-Road and Touring performance. Set targets after reconciling that bridge with capacity and dealer economics. Scale only interventions with repeatable contribution gains and acceptable service outcomes; portfolio share should remain a diagnostic measure rather than the sole success criterion.
Strategic priorities
Reconcile the baseline before interpreting seasonality
Finance and analytics should validate product mappings, reporting dates and gross-profit calculations, then compare complete periods before approving campaign timing.
Test the dealer barrier that the evidence supports
Use structured interviews and stock or display checks to choose a focused pilot. Treat pricing, awareness and product fit as hypotheses until validated.
Reward contribution and durable customer demand
Align dealer support with incremental economics, availability and repeat purchase evidence. Include cannibalisation and support costs in the scale decision.
Path to implementation
Proposed sequencing and decision gates.
Month 1 · Proposed
Establish a trusted sales baseline
Analytics lead and finance reconcile category totals, date coverage, gross margin and data definitions.
Decision gate: Finance signs off comparable-period reporting and an auditable product hierarchy.
Months 2–3 · Proposed
Diagnose dealer opportunities
Sales operations combine a decision-focused dashboard with interviews, stock checks and customer-objection evidence.
Decision gate: A specific barrier, intervention cost and comparison design are agreed for each pilot cohort.
Months 4–6 · Proposed
Run a controlled commercial pilot
Regional managers deliver selected dealer support while finance evaluates incremental contribution and category displacement.
Decision gate: Positive contribution after support costs and acceptable inventory and Touring performance justify wider rollout.
Months 6–12 · Proposed
Scale the proven interventions
Commercial leadership expands effective dealer support; analytics adds validated forecasts and actionable alerts.
Decision gate: Results repeat across comparable dealer cohorts, with stable data quality and accountable management use.
Value and measurement
The academic deliverable connects a documented concentration finding to a practical BI and commercial testing programme. The revised case strengthens seasonal interpretation, economic measurement and decision ownership. No dashboard deployment, dealer pilot, sales uplift or realised financial benefit is claimed.
Sources and scope
The original transactional workbook was not included in the supplied archive, so the reported GBI totals could not be independently recomputed. The revised report is the numerical source; the earlier draft’s unsupported product labels and causal explanations are excluded. Historical simulated transactions lack dealer inventory, marketing costs, customer research and competitive market share.
Revised academic analysis
APU Assignments.zip → Business Intelligent System_Assignment → GBI_BIS_Report_Roshmeet_Revised.docx. Sections 3–5 provide scope and numerical findings; sections 10–12 provide proposals and limitations.
Earlier draft and assessment materials
GBI_BIS_Report_Roshmeet.docx consolidated into this project. BIS Assignment Guidelines and assessment questions define scope; their examples are not presented as completed work.
- Microsoft · Star schema guidance (opens in a new tab)
Primary technical guidance informing the proposed fact, dimension and measure design.
- BCG · The Product Portfolio (opens in a new tab)
Original portfolio framework; used to distinguish competitive market share and growth from GBI’s internal category revenue mix.
Continue reading
Related case studies
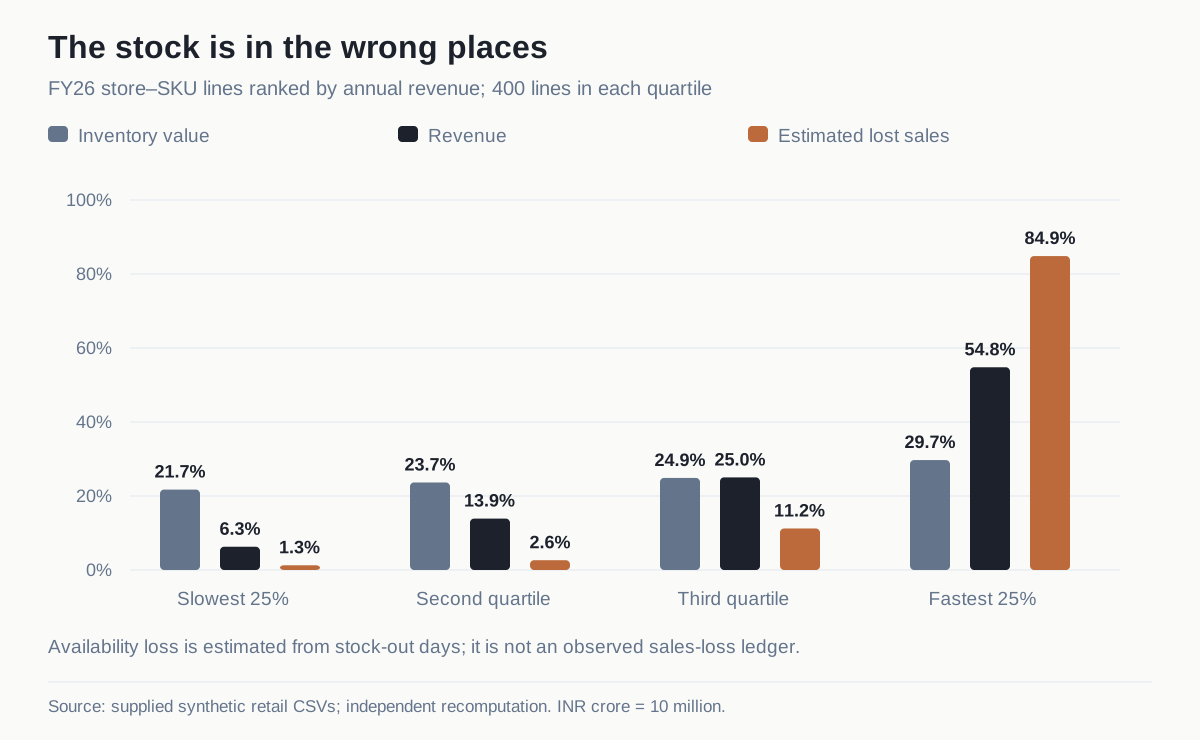
Retail operations / Profitability analytics / Inventory optimisation
Retail Operations Transformation & Profitability Optimisation
An end-to-end retail profitability diagnosis connecting store economics, assortment, inventory and a staged investment case across a simulated 20-store chain.
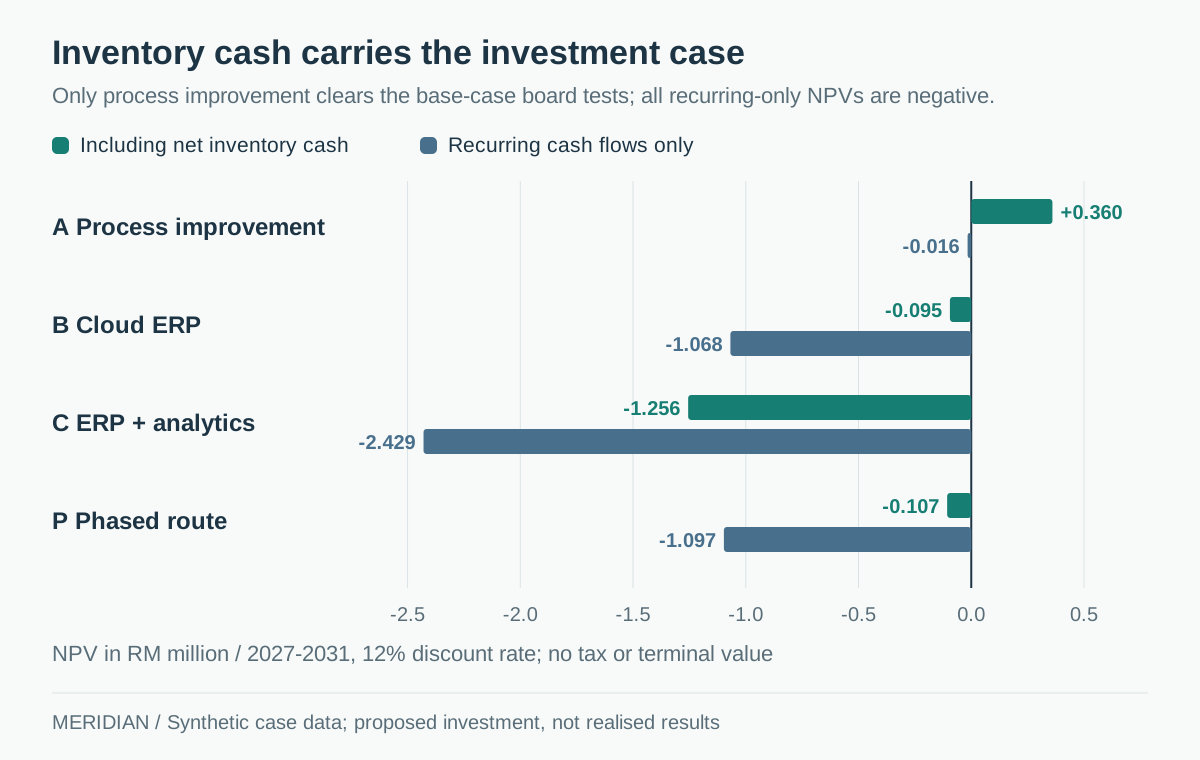
ERP investment / Operations transformation / Financial modelling
Meridian Precision Components: Make the ERP earn its place
A process-first manufacturing transformation strategy that tests an ERP investment against operational evidence, working-capital economics and production risk.
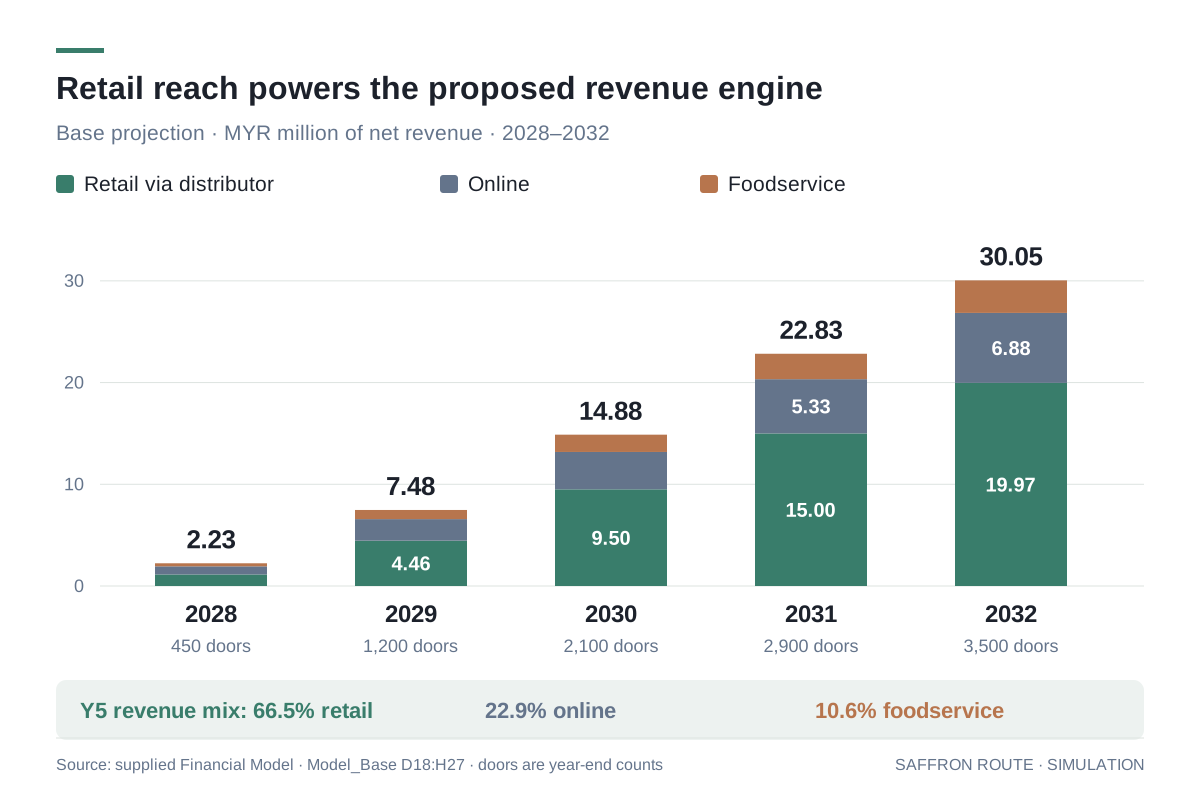
Market entry / Financial modelling / Commercial strategy
Saffron Route Foods: a staged route into Malaysia
An evidence-led market-entry case connecting consumer segmentation, distributor economics and a five-year financial model to explicit investment gates.